
To monitor an MQTT broker’s state effectively, you can use tools like Grafana to create dashboards that visualize metrics like client connections, data throughput rate, and CPU usage.
A previous article showed how to expose Pro Mosquitto broker metrics in Prometheus using the broker’s built-in Prometheus Metrics Exporter integration. This article will use Prometheus as a data source to display Pro Edition for Eclipse Mosquitto™ MQTT metrics in a Grafana dashboard.
In this way, you get a complete system for managing visualizations, alarms, and notifications.
Grafana offers the following features:
- Seamless integration between Prometheus and Grafana: As one of the first data source integrations in Grafana, Prometheus works perfectly together.
- Advanced graphics, transformations, and analytics: Grafana offers customizable dashboards and charts, perfect for representing MQTT data.
- Near real-time monitoring: Observe live data within seconds of it being stored in the Prometheus database.
- Integrated alarm and notification system: Grafana has an integrated Prometheus Alertmanager, simplifying the building of alerts and complex queries. It also provides a customizable system for triggering notifications across many channels.
How to deploy Grafana
In this tutorial, I’ll walk you through deploying Grafana using Docker. This guide assumes you have already installed Docker and the Docker compose plugin.
To get started, follow these steps:
1. Create a Docker compose file.
- For Linux or Mac, use:
$ nano docker-compose.yml. - For Windows, use the Notepad, Notepad++, or any other text editor.
2. Next, copy the following settings into the file you just created.
services:
  grafana:
    image: grafana/grafana:latest
    container_name: grafana
    restart: unless-stopped
    ports:
      - '3001:3000'
    volumes:
      - grafana-storage:/var/lib/grafana
  environment:
      	      - GF_SECURITY_ADMIN_PASSWORD=your_secure_password

volumes:
  grafana-storage:
Let’s explore the settings of this Docker compose file:
- Image: Uses the latest Grafana image from Docker Hub.
- Container Name: Sets the container name to grafana.
- Restart Policy: Configures the container to restart automatically unless explicitly stopped.
- Port Mapping: Maps port 3001 on the host to port 3000 in the container, making Grafana’s web interface accessible. Please note that Grafana uses port 3000 by default, but I have changed the host port to 3001 because I’m already using port 3000 for the Pro Mosquitto™ MQTT broker.
- Persistent Storage: Creates a named volume called
grafana-storageand mounts it to/var/lib/grafanain the container. This ensures that Grafana’s data persists across container restarts. - Environment variable: Use this setting to set up an initial password for the user admin. Replace
your_secure_passwordwith your actual password.
3. Save the file. If you use nano, press Ctrl+O to save, and Ctrl+X to exit.
4. After that, go to the directory where you created the Docker compose file and run the following command to deploy Grafana.
In Linux/Mac:
$ sudo docker compose up -dIn Windows:
docker compose up -d5. After executing the previous command, you can execute the following to check that the Grafana container is running.
In Linux/Mac
$ sudo docker psIn Windows
docker psAs a result, you will see something similar to the output in Figure 1.

Figure 1 - Grafana container running.
6. Now, access the web interface of Grafana by pointing your browser to http://localhost:3001. See Figure 2.
Figure 2 - Grafana’s login page.
Connecting Prometheus to Grafana
In this section, you will see how to connect Prometheus to Grafana. By connecting them you will be able to use Prometheus as a data source for Grafana.
To do so, follow these steps:
1. First, log in to Grafana using the admin username and password you set in the docker-compose file. You will see the Grafana home page, as shown in Figure 3.
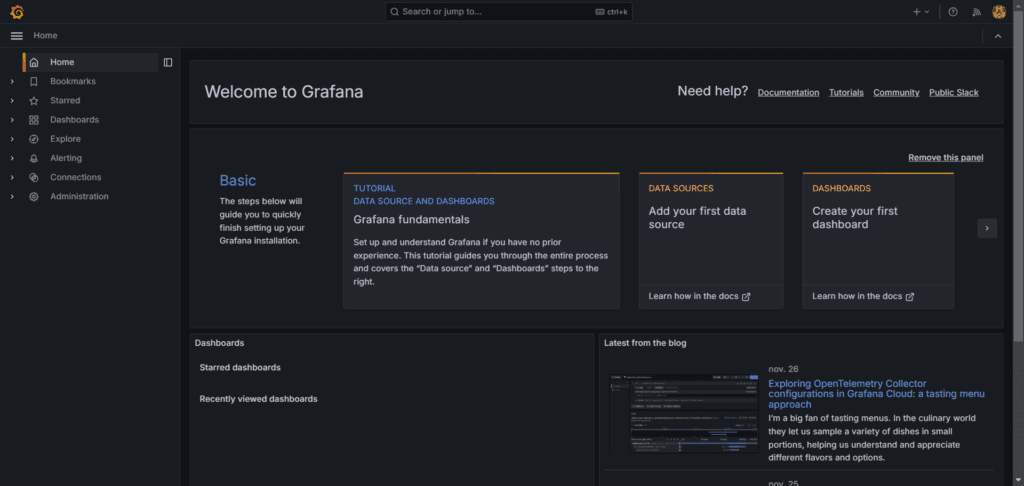
Figure 3 - Grafana home page.
2. Next, go to the left menu and click on Connections > Add new connection. Use Figure 4 as an illustration.
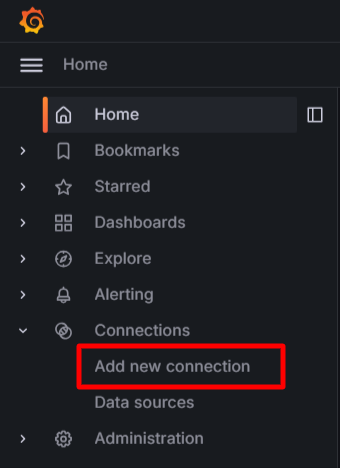
Figure 4 - Add a new connection in Grafana.
3. On the connections page, look for Prometheus and select it, as shown in Figure 5.
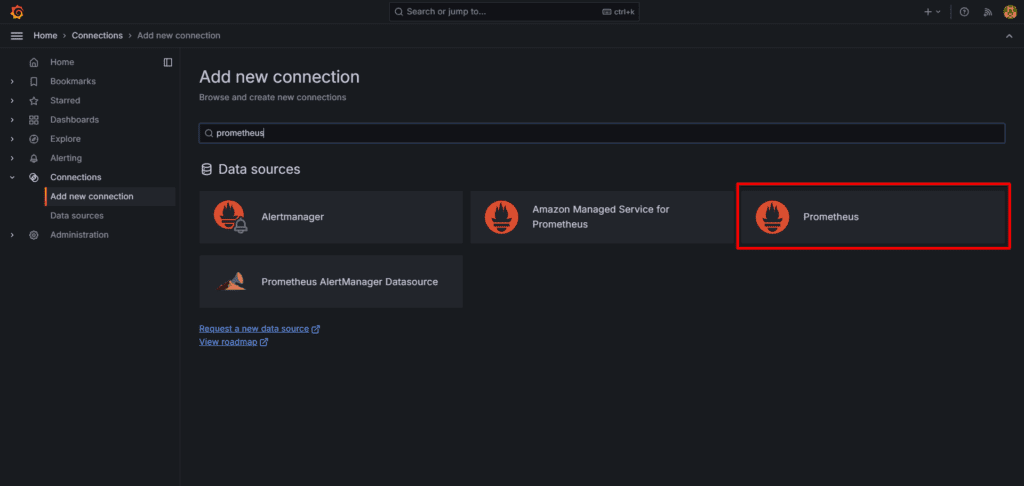
Figure 5 - Select “Prometheus” connection in Grafana.
4. Then, on the Prometheus page, click “Add new data source” at the top right. This will generate a new data source based on a Prometheus connection. See Figure 6.
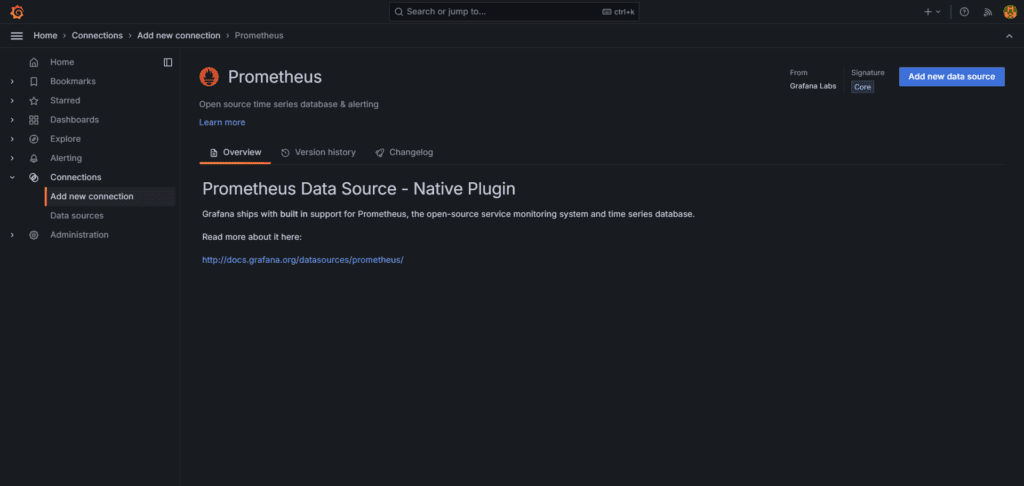
Figure 6 - Add new Prometheus data source in Grafana.
5. The previous step will lead you to the data source configuration page. As I haven’t used authentication in this Prometheus instance, the only setting you have to specify is the URL. Add this value: http://your-host-ip:9090 in the Prometheus server URL setting. Then, replace “your-host-ip” with the IP address of your computer. See Figure 7.
Note: This example uses unencrypted connections. In a production environment, it’s recommended to use encryption to transfer data between systems that are exposed to external connections (beyond the host).
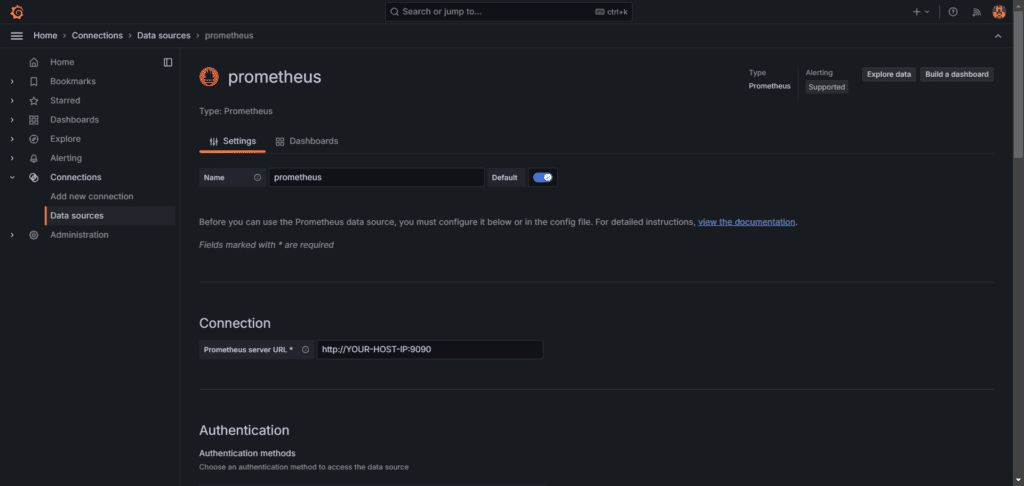
Figure 7 - Configuring the Prometheus data source.
6. After saving the configuration, the new data source will appear on the Data Sources page, as shown in Figure 8.
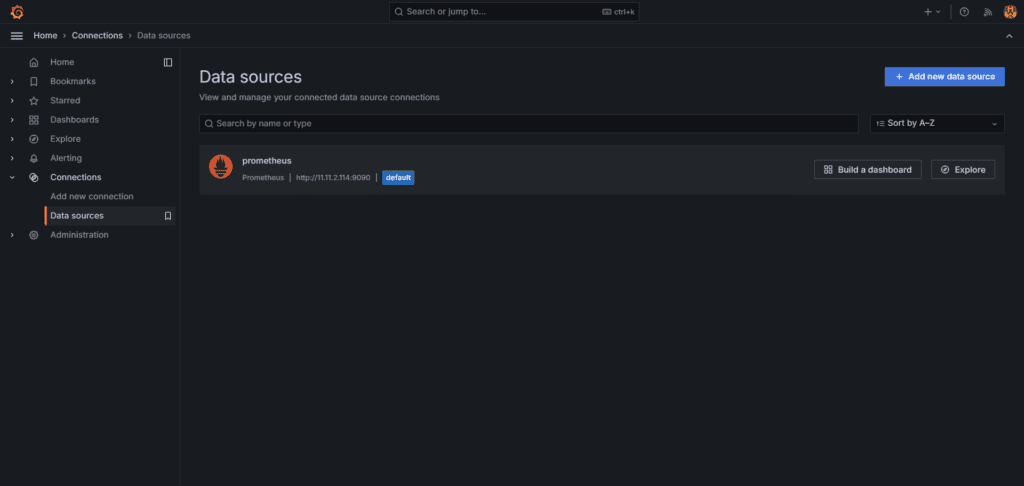
Figure 8 - Prometheus data source in Grafana.
In the next section, I will simulate devices to generate some data.
Simulating the device’s MQTT data traffic
Before building the dashboard in Grafana, you need to send data to the broker. To do this, use the Python script from the How to Export MQTT data to Prometheus article.
This script will generate ten MQTT clients and publish sensor data once per minute. You will also need an MQTT client to have subscription-related metrics.
Using the embedded client in Cedalo MQTT Platform
To utilize the client embedded in the Cedalo MQTT Platform, follow these steps:
- Sign up for the Cedalo MQTT Platform trial.
- Follow this guide to create your first client.
- Access the Platform and select the “Publish & Subscribe” option in the Tools section, as shown in Figure 9.
- Then, select the client you have created before using the dropdown list.
- Next, enter the password for the client.
- Click the “Connect” button and then on the Subscribe to the “All Topics” button. As a result, you will start seeing the payloads of the published messages on the Payloads panel, as shown in Figure 10.
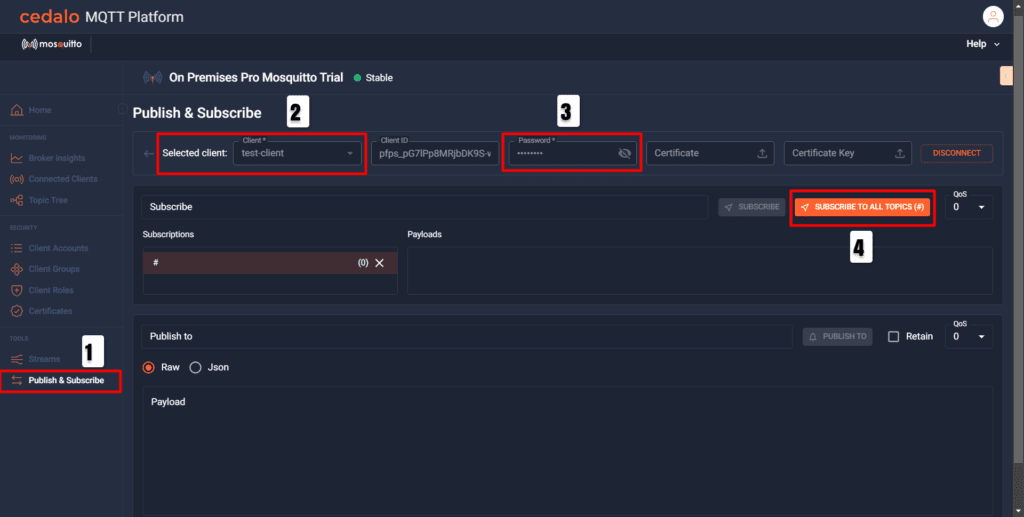
Figure 9 - Connect the embedded MQTT client.
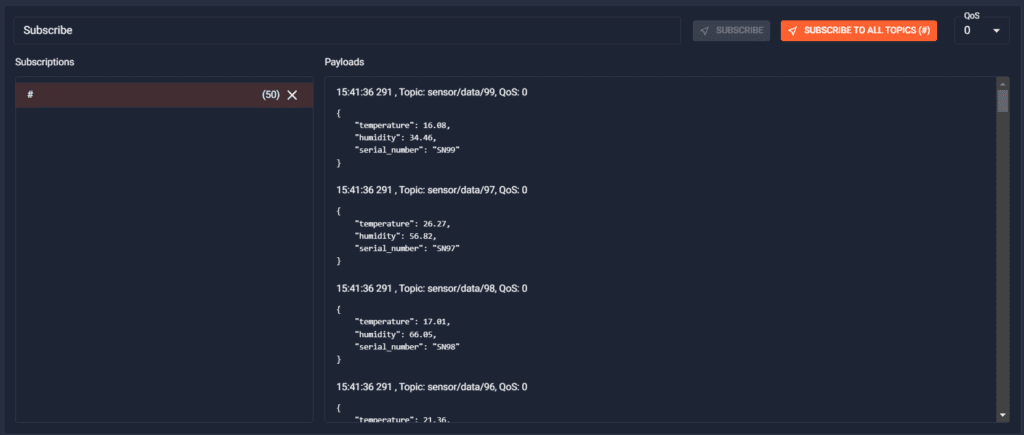
Figure 10 - Checking payloads.
After connecting Prometheus and Grafana and ensuring data is going through the broker, you can start using Prometheus data to build dashboards in Grafana.
Creating the MQTT dashboard in Grafana
In this section, I will create a new MQTT Grafana dashboard to show Pro Mosquitto MQTT broker metrics. Get free access to the Cedalo MQTT Platform on-prem trial to start experimenting with Pro Mosquitto.
To create a new dashboard follow these steps:
1. Go to “Dashboards” on the left menu. Here, you will see a page with a big blue button, as shown in Figure 11.
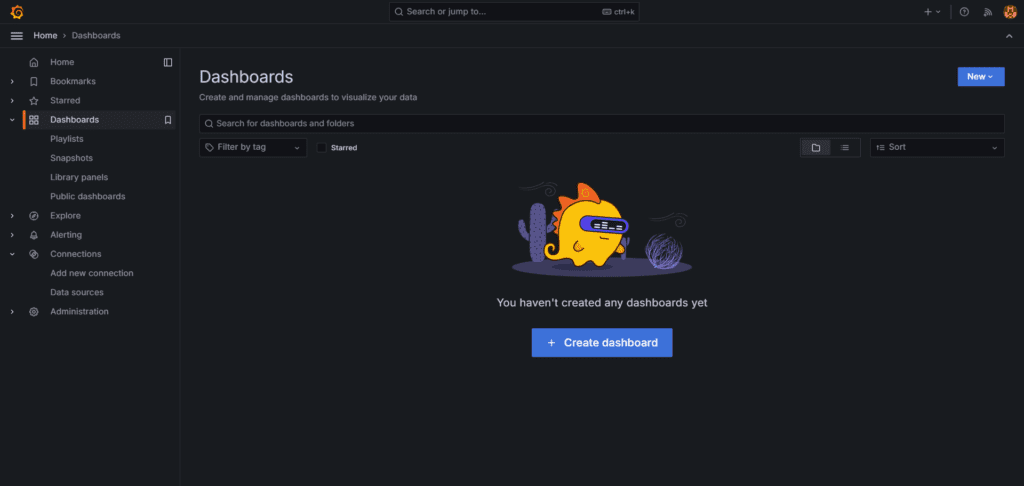
Figure 11 - Dashboard’s page in Grafana.
2. Then, click on the “+ Create dashboard” button. This will lead you to the new dashboard page, as shown in Figure 12.
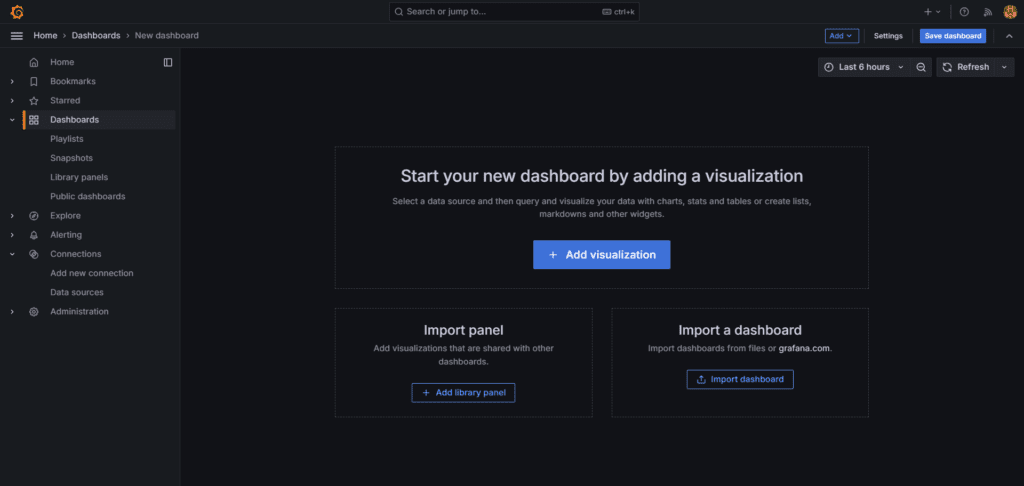
Figure 12 - New dashboard page.
3. Click on the “+ Add visualization” button. At this point, this will open a window where you can select the data source. Select Prometheus. Use Figure 13 as an illustration.
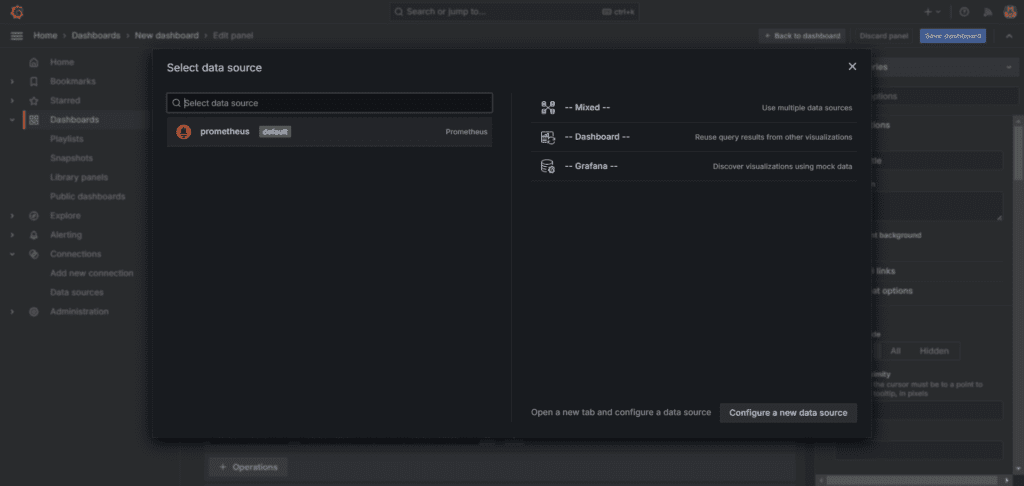
Figure 13 - Selecting Prometheus as a data source.
4. The previous step will create a new visualization (Time series by default). After that, you can start exploring the available metrics from the query interface See Figure 14.
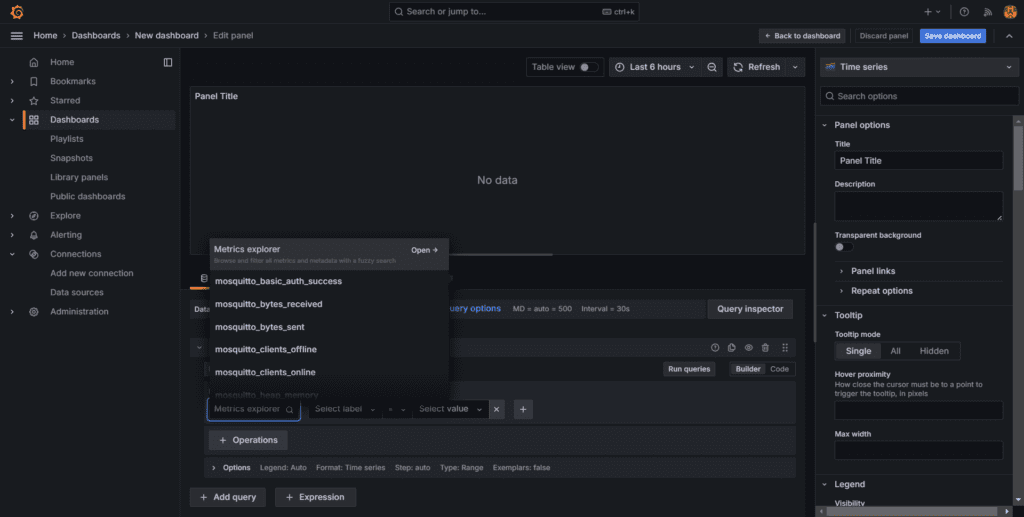
Figure 14 - Explore the available MQTT broker metrics.
5. Select the metric mosquitto_clients_online, assign a title to the panel, and click “Save”. This will create a time-series panel showing the evolution of the total MQTT clients connected to the broker. See Figure 15.
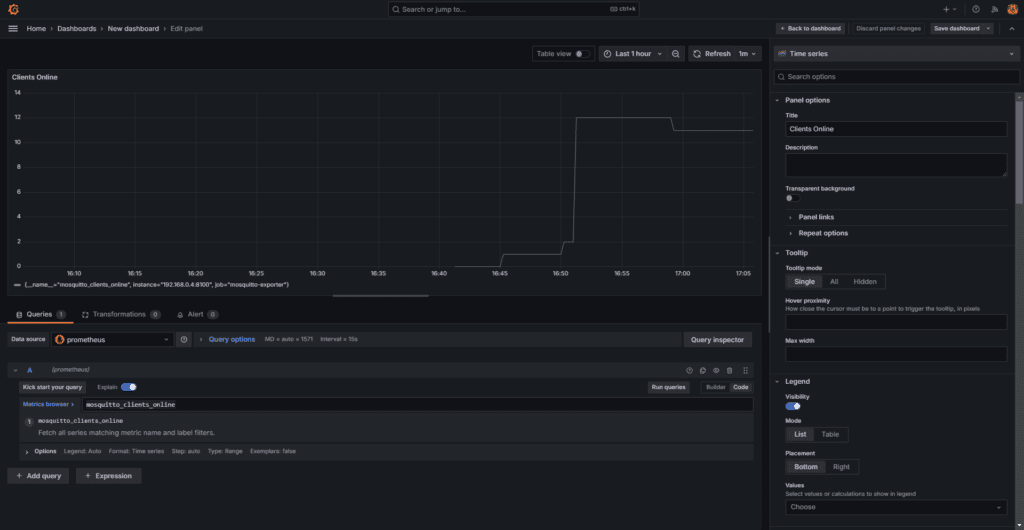
Figure 15 - Time-series panel showing the number of connected clients.
6. Then create a new time-series panel using the metric mosquitto_sessions. In this case, use the “Add” button at the top right of the dashboard to add a new visualization.
7. Now, create a new panel using the Stat panel. This panel shows the last value of the metric. It also shows a qualitative evolution in the background. Switch the query section from “Builder” to “Code” mode. In the query section, enter the following expression:
rate(mosquitto_publish_bytes_received)PromQL (Prometheus Query Language) is a powerful and flexible query language explicitly designed for Prometheus. In detail, it allows you to select, aggregate, and analyze time series data in real-time.
The previous query calculates the data rate in bytes taking the last five minutes of data (See Figure 16). To learn more about Prometheus queries, refer to the Prometheus docs.
Note: You can set the unit of the visualization panel in the Standard options section. In this case, I have used bytes/sec(SI) to show data transfer units.
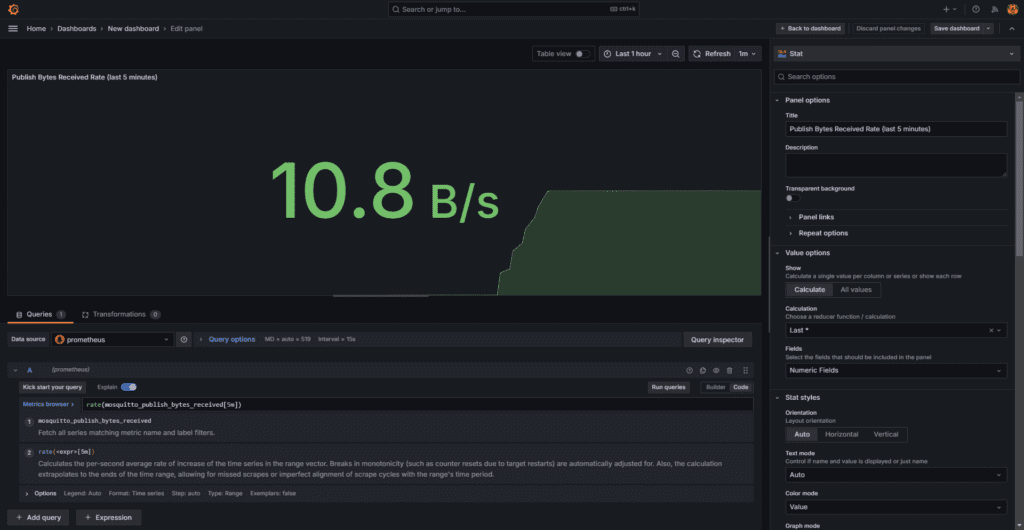
Figure 16 - Create a Stat panel.
8. Create new Stat panels for each of the following expressions:
rate(mosquitto_publish_bytes_sent)
mosquitto_sessions
mosquitto_subscriptions
9. After creating these panels, you will have something similar to the dashboard shown in Figure 17. Notice that you can select colors and styles on the configuration tab of each panel.
Also, you can change the position and the size of all the panels to organize them most conveniently.
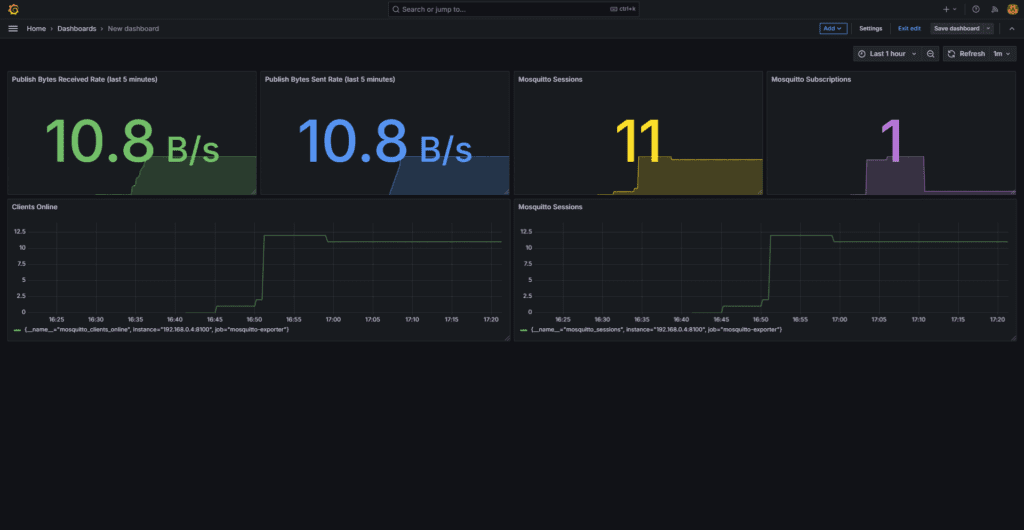
Figure 17 - Current dashboard showing panel organization.
Now that you have created a basic dashboard, let’s add more interesting metrics to it.
Adding more MQTT broker metrics to the Grafana dashboard
Another useful metric is process_cpu_seconds_total, which represents the total number of CPU spent in seconds by a specific process. As a result, it is a cumulative counter that continuously increases as long as the process runs.
To show the total CPU utilization, use the following expression.
rate(process_cpu_seconds_total) * 100Choose a Gauge visualization and use the previous expression. Also, change the units to percentages, as shown in Figure 18. You will probably get a very low value, as the broker is processing just a few messages per second.
Moreover, to obtain different values, you can change the frequency of publication in the Python script.
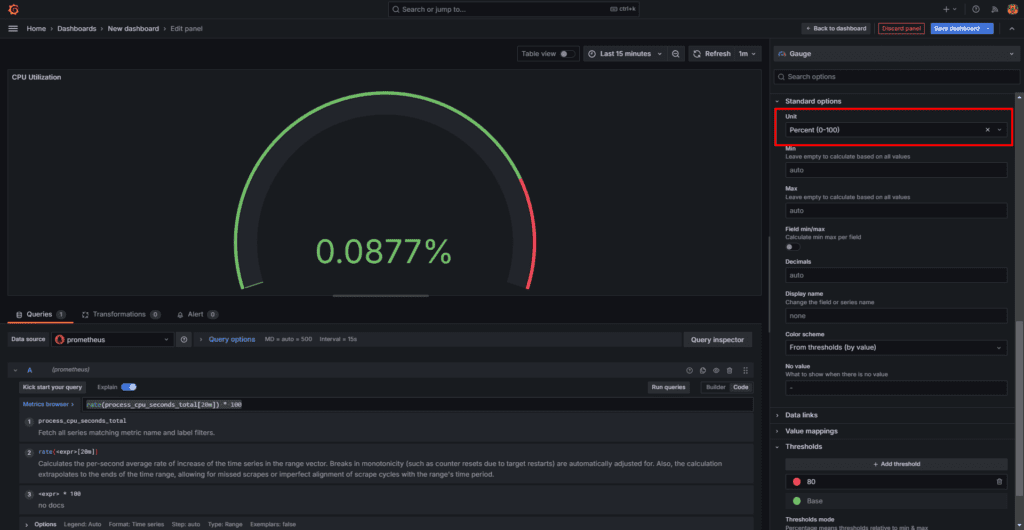
Figure 18 - CPU utilization in percentage unit.
Now, let’s add another type of visualization, the Bar Gauge (see Figure 19). You can choose between different styles. In this case, I chose the horizontal orientation and the Retro LCD display mode.
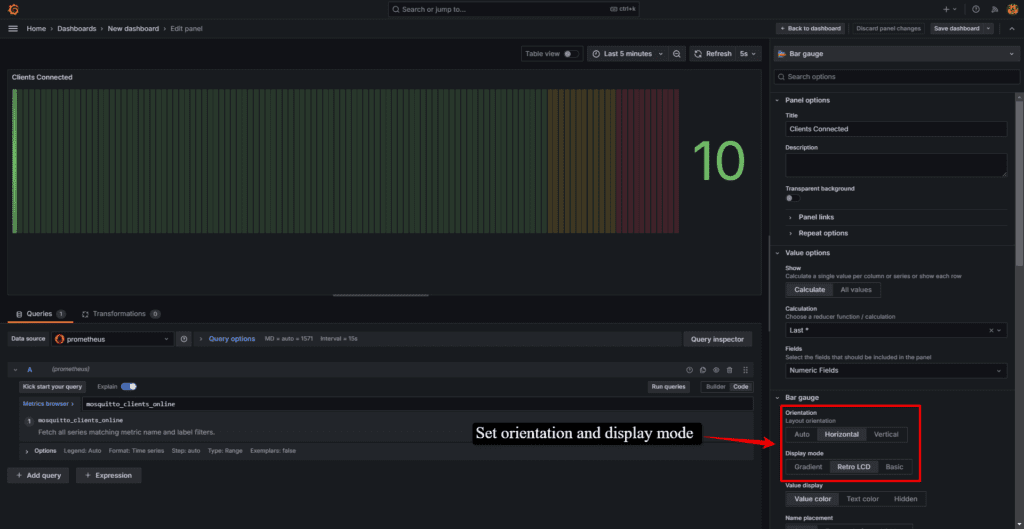
Figure 19 - Bar gauge visualization panel.
This visualization shows the number of connected MQTT clients. The panel’s minimum value is zero, and the maximum is 10,000 because these are the current license’s limits.
Also, the panel’s thresholds were adjusted to 8,000 and 9,000 for the colors yellow and red, respectively. See Figure 20.
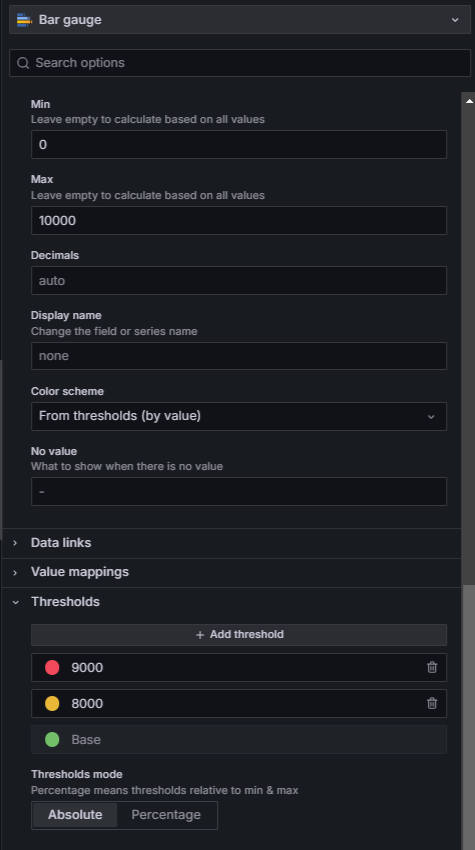
Figure 20 - Threshold settings.
With this last addition, you have a good dashboard for your MQTT broker monitoring (see Figure 21). Moreover, you can add as many metrics as you need, and select the type of visualization that better fits each case.
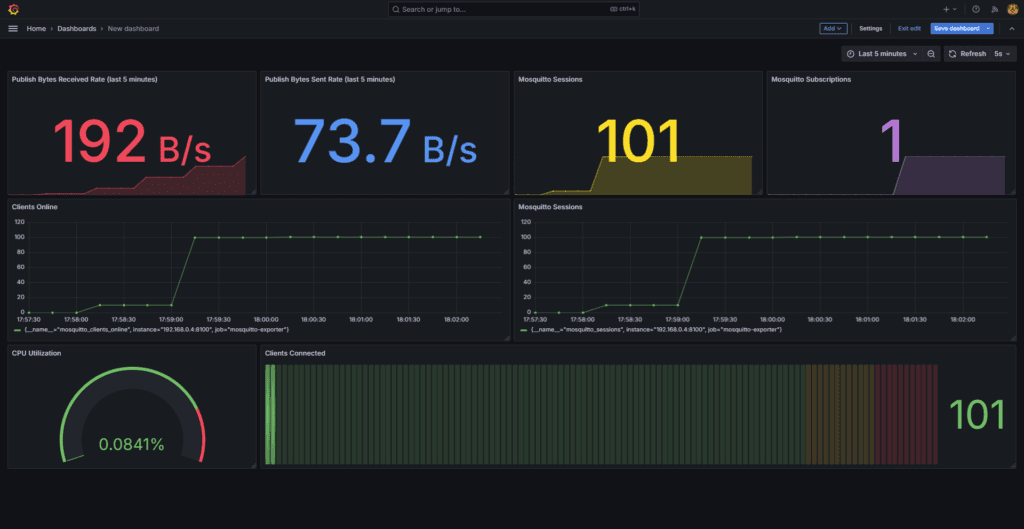
Figure 21 - Complete dashboard.
In the next section, I will show how to implement alerts and send notifications in Grafana.
Alerts and Notifications in Grafana
Undoubtedly, one powerful feature of Grafana is its capacity to analyze metrics, run alert conditions, and trigger notifications in many different ways.
Creating Alerts in Grafana
The alerting system in Grafana lets you configure different alert conditions from a simple comparison of a single value to a combination of values and conditions. Moreover, the alerts in Grafana can be as complex as you need.
To create an alert, follow these steps:
1. At the left top corner, open the menu and choose Alerting > Alert rules on the left menu. This will lead you to the alerting page, as shown in Figure 22.
2. As you can see, the page doesn’t show any alerts. To create the first one, click on the big blue button with the text “+ New alert rule.”
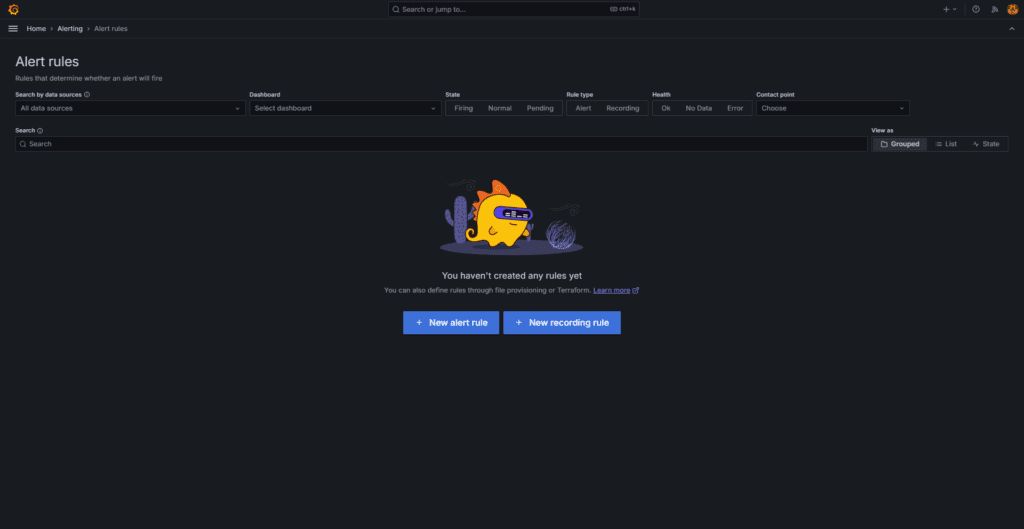
Figure 22 - Alert rules page.
3. The previous step will guide you to the new alert page. On this page, you have to choose a metric and a condition. In this case, we are using the following metric expression:
mosquitto_clients_onlineAs a result, this expression returns the number of clients online over the last 10 minutes. See Figure 23.
4. If many clients are not online, it could indicate an issue from the server side, so it’s good to be notified. Let’s imagine that we have 100 MQTT clients working continuously, and we want to be notified if more than 50% are disconnected to investigate it. To experiment with this alert, you can change the number of clients in the Python script.
5. In the alert configuration, set the expressions as follows:
- Click on the “Add query” button to create a new query.
- Then, select Prometheus as a data source and enter the expression:
mosquitto_clients_online. - Next, leave the B expression with the default settings. This expression reduces the value to the last metric value obtained by the query.
- Finally, set the C expression (threshold) condition to IS BELOW, and enter the value of 50.
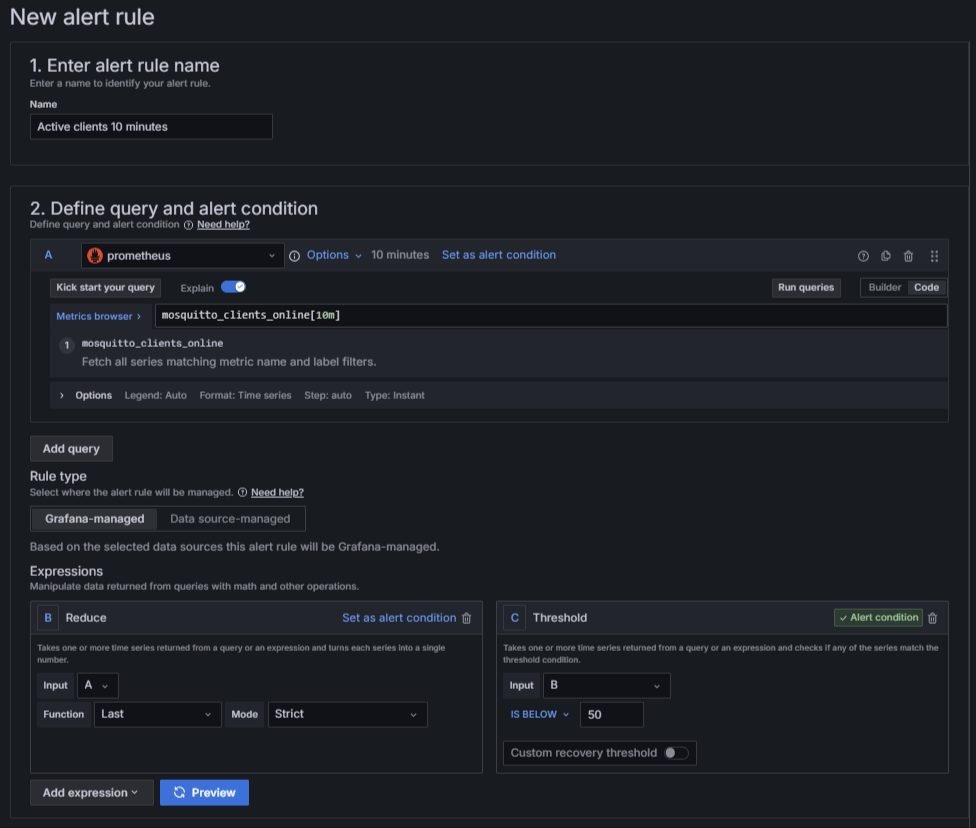
Figure 23 - Alert settings.
6. Now, let’s go to the next section of the configuration. Here, I will configure the behavior of the alarm and the notification.
Follow these steps:
- Click the “New Folder” button to create a new folder to organize the alert. Give it a meaningful name, like “Broker Alerts”. See Figure 24.
- Also, create a new evaluation group by clicking on the “New evaluation” grou
pbutton. - At this point, set the pending period to 2 minutes or more, as the scraping in Prometheus is set to 1 minute. This guarantees that you will have new values every time you evaluate the alarm. See Figure 24.
- After that, set the contact point you will use to send the notification. Only email is enabled by default, although you will have to configure it in Grafana. You can check the documentation here.
- Finally, click on the “Save rule and exit” button.
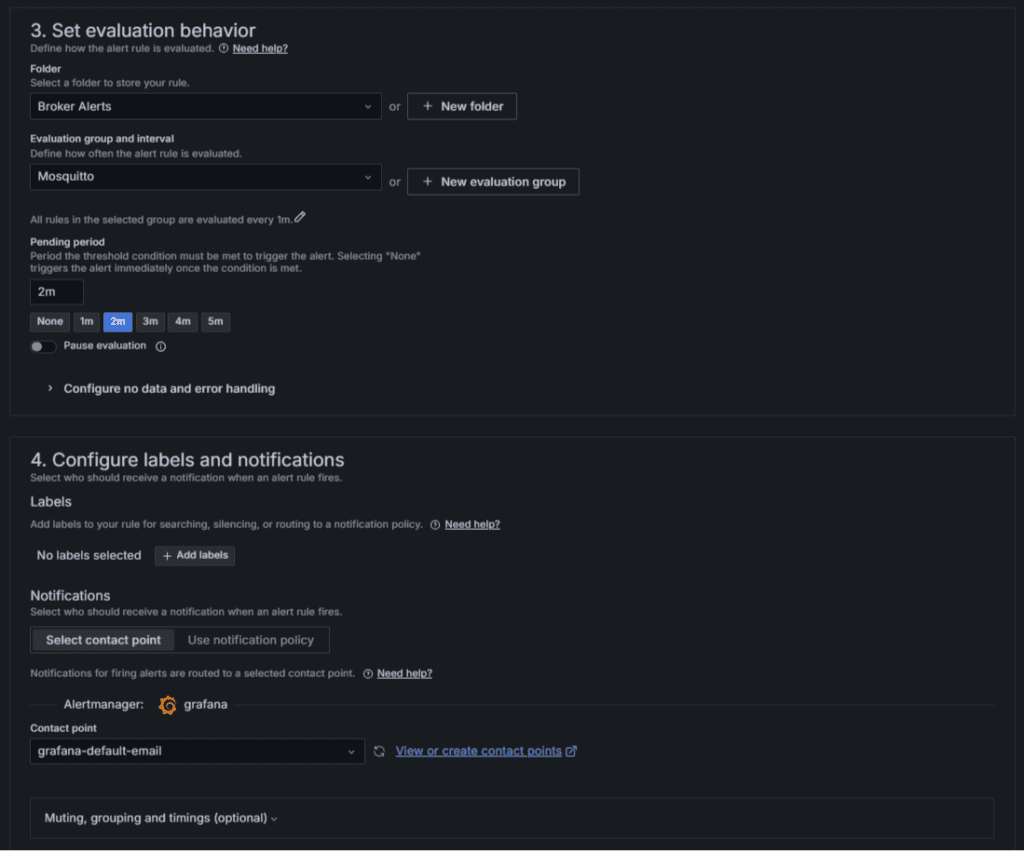
Figure 24 - Evaluation and notification.
With this configuration, you can start receiving notifications when the number of MQTT clients is below 50.
Please note that the scraping period from Prometheus will introduce a delay, as it does with the metric values shown in the dashboard. However, you can adjust the scraping period in Prometheus’s configuration file.
Troubleshooting Common Issues
Some common problems can arise when you want to deploy and integrate many independent systems and applications. Let’s analyze some of them:
1. Docker throws an error when trying to deploy the container: We are using Docker Compose to deploy the container, so you need to check two things:
- Check that you have the Docker Compose plugin installed in your system. To check if the Docker Compose plugin is installed, you can use the following command:
$ sudo docker compose versionIf Docker Compose is installed, you’ll see output similar to:
$ Docker Compose version vX.Y.ZWhere X.Y.Z represents the version number13.
If the plugin is not installed, you’ll receive an error message indicating that the ‘compose’ command is not recognized.
To install the docker compose plugin follow these steps:
- Update the package index:
$ sudo apt-get update - Install the Docker Compose plugin:
$ sudo apt-get install docker-compose-plugin
- Check that the YAML file is not malformed. YAML doesn’t accept tabulation, and it’s a common issue. You can check your file using free tools like https://www.yamllint.com/
2. Prometheus can’t connect to the exporter: This can happen for many reasons. The most common are:
- A wrong IP address in the configuration file of Prometheus. Check that you have entered the correct IP address where the MQTT broker is running. If you run this in a testing environment, the IP address could have changed. In this case, you must deploy the container again using the correct configuration.
- If your network has a firewall, check permission access for protocols and ports. Also, check the firewall running on the server if you are using it.
3. Grafana can’t connect to Prometheus: This is similar to the previous point. Here, you will have to check the IP of the Prometheus instance and look for restrictions in the network due to firewalls and security measures. Also, include the correct TCP port to connect to Prometheus.
Conclusions
In addition, I created several visualization panels to show the data most conveniently.
Finally, I showcased configuring alarms and notifications in Grafana to evaluate specific conditions and trigger notifications accordingly.
Following the steps covered in this article, you can add more visualizations, according to your needs. Also, you can create more alarms, and use many notification channels, such as MQTT, Telegram, Slack, Discord, Microsoft Teams, and more.


