
In this tutorial, you will learn how to sync MQTT metrics data to Prometheus using Pro Mosquitto, an advanced version of the widely used open-source Mosquitto broker. It will act as the central hub for receiving messages from your IoT devices.
I’ll utilize the built-in Prometheus Metrics Exporter in Pro Mosquitto to expose key broker metrics. This exporter will send important broker data to Prometheus.
By configuring Prometheus to scrape these metrics from the exporter’s endpoint, you will be able to continuously monitor and analyze your MQTT data. This setup leverages Prometheus’ powerful querying and alerting capabilities to provide valuable insights into your IoT ecosystem.
What is Prometheus?
Prometheus is an open-source monitoring system originally developed by SoundCloud in 2012.
In 2016, it became the second project hosted under the Cloud Native Computing Foundation, after Kubernetes. Prometheus allows you to collect and store metrics as time-series data, where each data point is associated with a timestamp and optional key-value pairs called labels.
In addition, this combination of timestamps and labels allows you to process, analyze, and display the data in various formats. In this tutorial, I’ll use Prometheus to expose the performance parameters of the Pro Mosquitto broker.
Why export MQTT data to Prometheus?
I will use Prometheus to obtain metrics related to the broker, such as message rates, client connections, etc.
By exporting Pro Mosquitto broker metrics to Prometheus, you can monitor broker performance, detect events and anomalies, and take action before system problems occur.
Additionally, these metrics can provide insights for forensic analysis into system crashes, performance bottlenecks, or other issues.
Setting up the Mosquitto MQTT broker integration with Prometheus
This section outlines the steps to install and configure Pro Mosquitto’s built-in Prometheus Metrics Exporter with Prometheus.
Installing and configuring the MQTT broker
Start by signing up for a Cedalo MQTT Platform trial and deploy an on-premises single-node Pro Edition for Mosquitto™ MQTT broker using Docker.
Next, log in to the Platform and create a username and password – remember to keep this info for the on-premises deployment (Figure 1). Follow the prompts to create a new project and download the files necessary to deploy Pro Mosquitto locally. Specifically, download the single-node file and trial license.
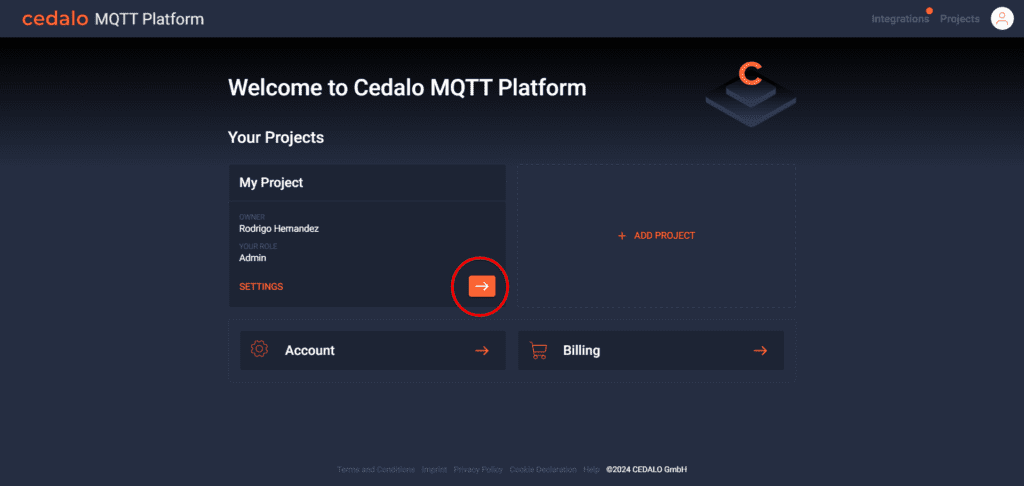
Figure 1 - Cedalo MQTT Platform welcome page
Now that you have the necessary files, you can proceed with the installation and configuration of the software.
Note: In order to proceed with the installations in this tutorial, you must install Docker and the Docker Compose plugin on your system.
The installation commands for the broker can differ depending on the operating system you use. This tutorial uses Linux commands specific to Debian-based distributions. If you prefer a Ubuntu Linux installation using Docker, this guide provides complete instructions.
Follow these steps to install Pro Mosquitto:
1. Uncompress the directory you downloaded in the previous steps.
2. Place your Pro Mosquitto license in the /license directory, with the name license.lic.
3. Next, go to the /mosquitto/config directory and open the mosquitto.conf file to enable the Prometheus exporter in Pro Mosquitto.
4. Uncomment the following lines in the mosquitto.conf file in order to activate the exporter:
# Prometheus Metrics plugin
plugin /usr/lib/cedalo_metrics_prometheus.so
# plugin_opt_bind_address 127.0.0.1
plugin_opt_port 8100
plugin_opt_update_interval 60
Notice that I left the bind option commented. By default, the exporter uses 0.0.0.0 (all network interfaces). If you want to bind the exporter to a specific interface, uncomment the line and specify your host’s IP address.
Since I’m using a Docker installation, keep the 0.0.0.0 interface unchanged, and instead specify the desired network interface when mapping port 8100 in the docker-compose.yml file, like this:
- <network_interface_you_want_to_use>:8100:81005. After that, open the docker-compose.yml file in the root directory of your Mosquitto setup and add the line shown in the following figure to expose the exporter port. This will bind the exporter to the 0.0.0.0:8100 address on your host. To bind it to localhost, specify - 127.0.0.1:8100:8100 instead:
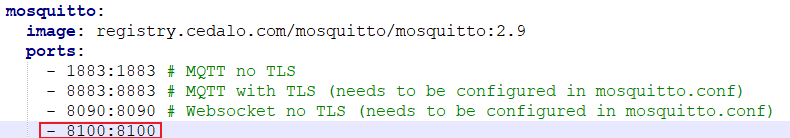
Figure 6 - Configuration to expose the exporter port.
6. Go to the folder containing your broker setup (folder with docker-compose.yml), open a terminal, and run the following command to start the setup:
- For Unix:
$ sudo docker compose up -d - For Windows:
docker compose up -d
7. Then, to confirm the containers are running, execute the following commands:
- For Unix:
sudo docker ps - For Windows:
docker ps
A list of containers will appear as shown in Figure 2.

Figure 2 - List of containers.
For Windows users, open the Docker Desktop Dashboard (Figure 3).
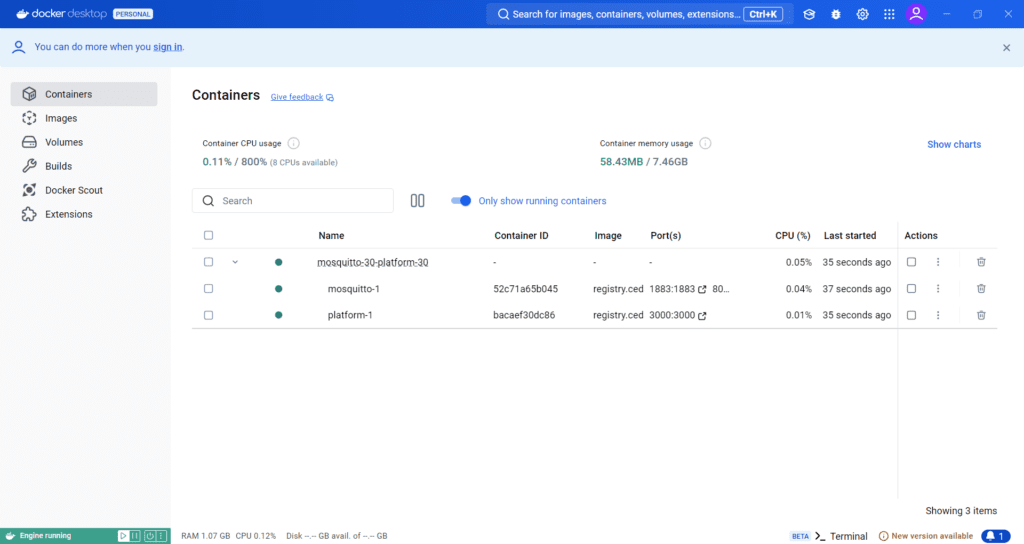
Figure 3 - Docker Desktop Dashboard.
8. To verify that the Prometheus Exporter is exposing Pro Mosquitto metrics, go to http://127.0.0.1:8100/metrics. The metrics should appear as shown in Figure 4.
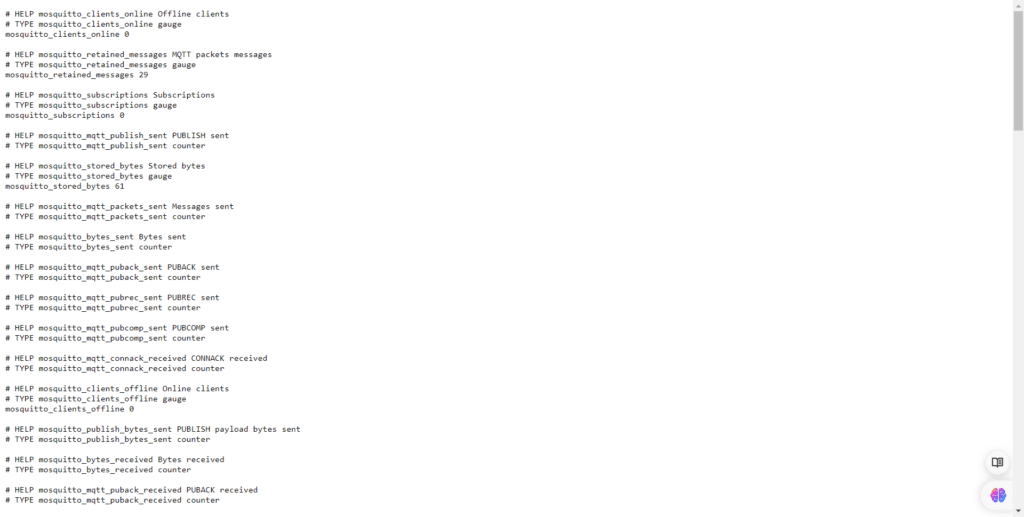
Figure 4 - Mosquitto metrics.
9. To access the Mosquitto Platform, point your browser to http://127.0.0.1:3000.
10. At this point, enter the user and password you created in the Platform.
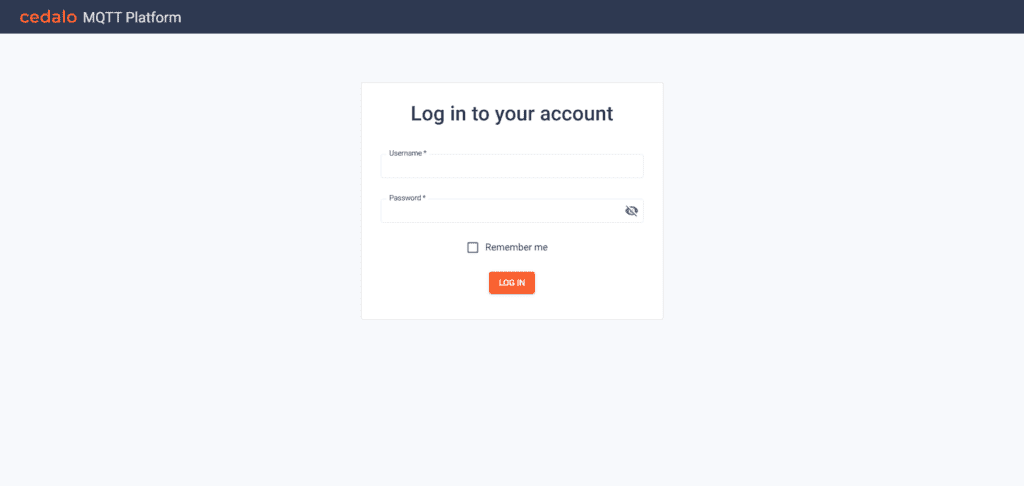
Figure 5 - Mosquitto Platform login page.
For full installation and configuration instructions, refer to this documentation.
Create an MQTT Client
Now, let’s will create a new MQTT client:
1. Open the Cedalo Platform and click on “Clients” from the left menu, then select “+ NEW CLIENT.”
2. Next, choose a name and a password for the new client, leaving all the other parameters unchanged. Then, click SAVE (see Figure 6).
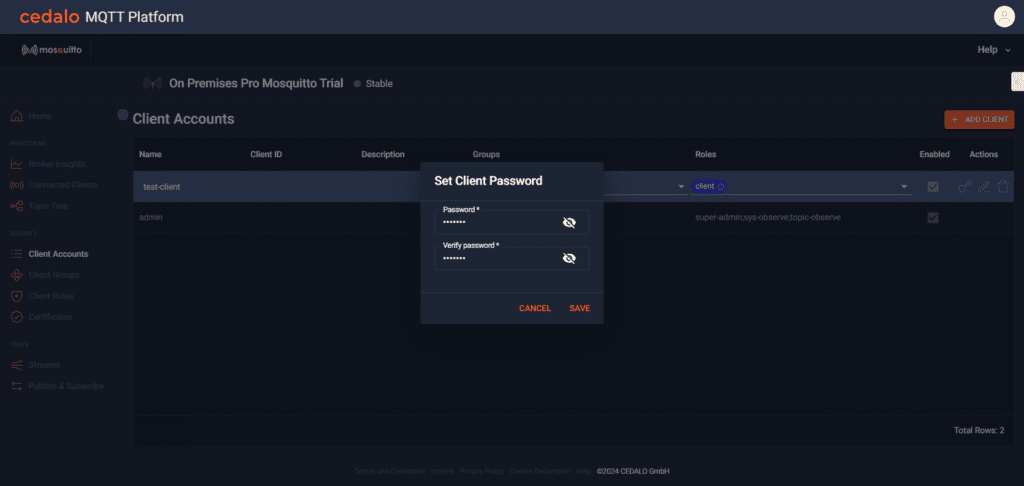
Figure 6 - Creating a new MQTT client.
3. In the Clients page, use the dropdown menu in the Roles column to select “client.” This role allows the exporter to be able to obtain all messages data from the broker.

Figure 7 - New MQTT client with “client” role.
Installing and configuring Prometheus
This section explains how to install and configure Prometheus to scrape, store, query, and visualize the metrics from the exporter.
To begin, install Prometheus by following these steps:
1. Create a new directory to host the Docker and configuration files. I will use ./prometheus directory:
mkdir prometheus2. Then, create a “config” directory inside ./prometheus. The directory structure should be as follows:
./prometheus
	./config
3. In the prometheus directory, create a docker-compose.yml file and edit it by copying the following content, then save and close the file:
services:
  prometheus:
    image: prom/prometheus
    ports:
      - "9090:9090"
    volumes:
      - ./config/prometheus.yml:/etc/prometheus/prometheus.yml
      - prometheus_data:/prometheus
    restart: unless-stopped

volumes:
  prometheus_data:
4. In the config directory, create a new prometheus.yml file, and edit it by copying the following content, then save and close the file:
scrape_configs:
  - job_name: 'mosquitto-exporter'
    metrics_path: /metrics
    static_configs:
      - targets:
          - <your-host-ip>:8100
5. Deploy the container by running the following command from the prometheus directory:
- On Unix:
sudo docker compose up -d - On Windows:
docker compose up -d
6. Lastly, check that the container is running:
- On Unix:
sudo docker ps - On Windows, you can view the dashboard of the Docker Desktop application or run the following command:
docker ps
7. Finally, you’ll be able to access the Prometheus interface by pointing your browser to http://127.0.0.1:9090.
Showing MQTT metrics in Prometheus
This section will explore Prometheus further and demonstrate how to query and display metrics.
Exploring the Prometheus web interface
You can access the Prometheus web interface by navigating to http://127.0.0.1:9090 in your browser (see Figure 8).
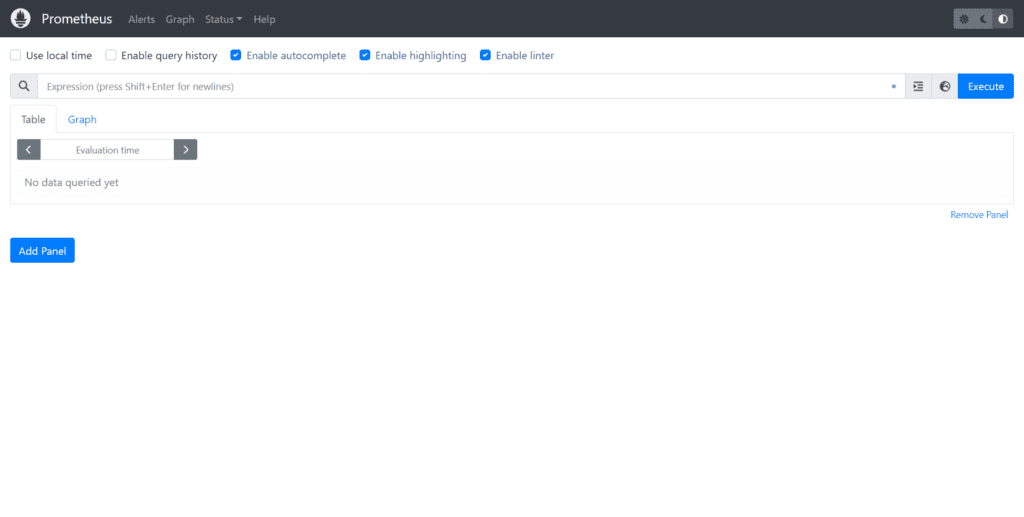
Figure 8 - Prometheus homepage.
First, check that Prometheus is connected to the exporters you set up earlier. In the “Status” menu, select “Targets,” as shown in Figure 9.
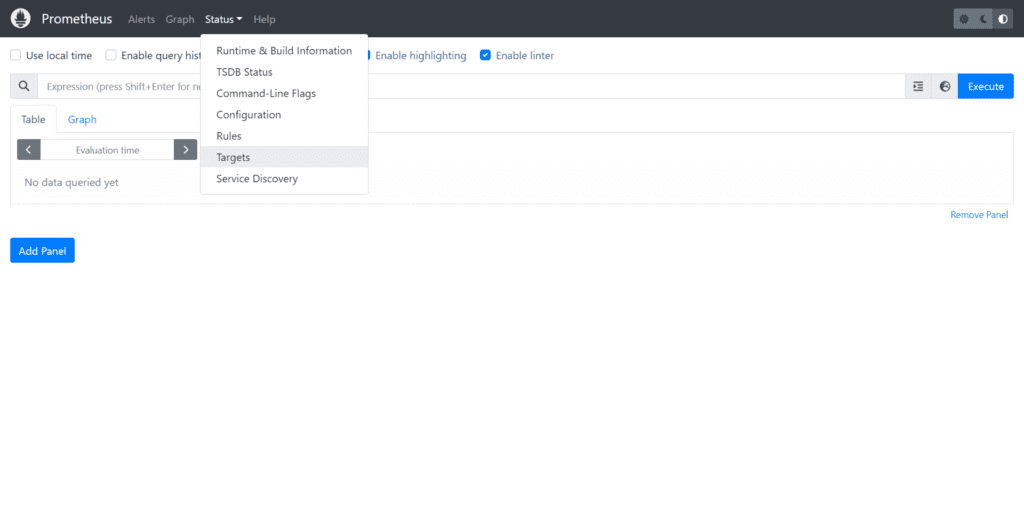
Figure 9 - Select “Targets” in the “Status” menu.
On the targets page, you’ll see a list of targets connected to Prometheus, in this case, the Pro Mosquitto Exporter (Figure 10).
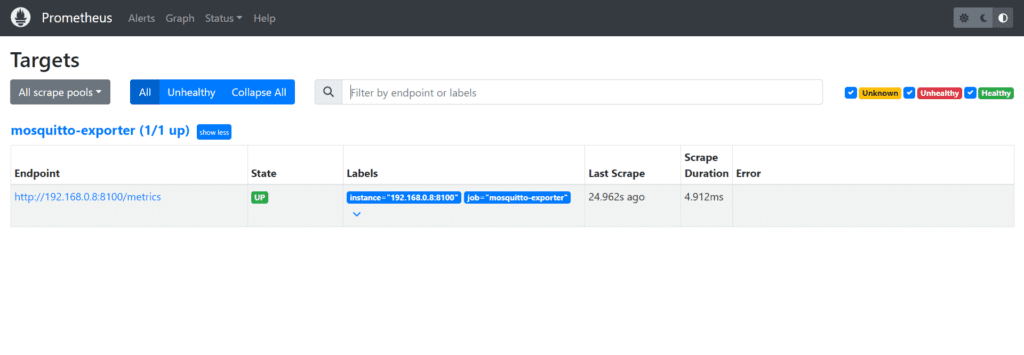
Figure 10 - List of targets connected to Prometheus.
Note that each endpoint in the list must appear as “Up” in the “State” column. If not, check the state of your broker container. Now that Prometheus is connected to the exporter, let’s explore the metrics you can obtain.
Exploring metrics in Prometheus
Before querying Prometheus, let’s discover the available metrics. Clicking the “world” button next to the “Executes” on the home page will open a window with all metrics, as shown in Figure 11.
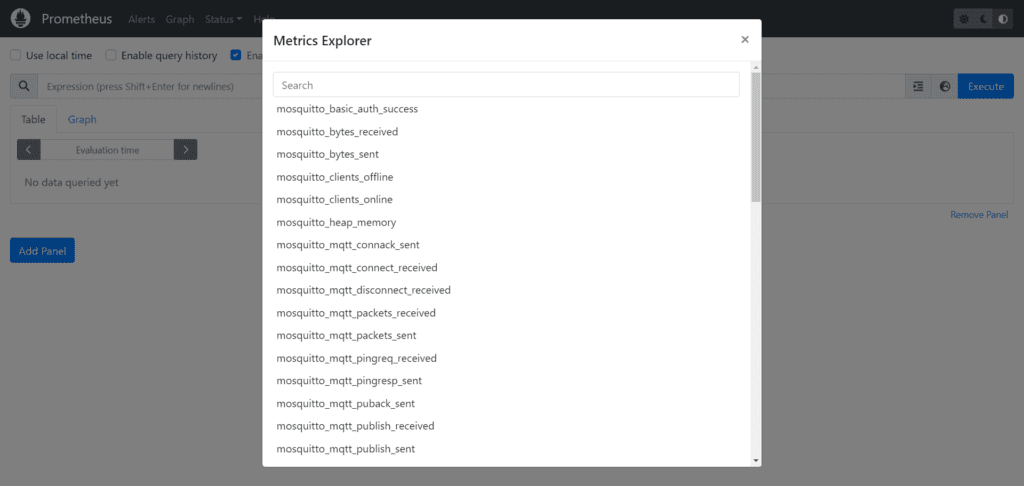
Figure 11 - Exploring metrics in Prometheus.
In the Metrics Explorer, you will see metrics from the Mosquitto exporter.
Using a Python Script to simulate devices
I will use a Python script to simulate devices and send MQTT messages to the broker. In other words, use the script to create ten MQTT publishing clients, each sending synthetic data with the following structure:
{
    "temperature": 23.45,
    "humidity": 55.67,
    "serial_number": "SN0"
}
The following Python code implements the following steps:
- Creates 10 MQTT clients and connects them to the broker.
- Generates synthetic data.
- Publishes the generated data on a specific topic using one of the created clients.
- Repeats steps 2 and 3 for each client.
- Waits one minute before sending a new message.
import paho.mqtt.client as mqtt
import random
import json
import time


# Function to generate random sensor values with metadata
def generate_sensor_data(sensor_id):
    return {
        'temperature': round(random.uniform(15.0, 30.0), 2),
        'humidity': round(random.uniform(30.0, 70.0), 2),
        'serial_number': f'SN{sensor_id}'
    }


# Callback function on connect
def on_connect(client, userdata, flags, rc):
    print(f"Connected with result code {rc}")


# Callback function on publish
def on_publish(client, userdata, mid):
    print(f"Message {mid} published.")


# MQTT broker credentials
broker_address = "your-broker-IP"
username = "your-client-username"
password = "your-client-password"


# Create and configure MQTT clients
clients = []


for i in range(10):
    client = mqtt.Client(f"Client{i}")
    client.username_pw_set(username, password)  # Set username and password
    client.on_connect = on_connect
    client.on_publish = on_publish


    # Connect to the broker
    client.connect(broker_address, 1883, 60)
    client.loop_start()  # Start the loop


    # Add client to the list
    clients.append((client, i))


try:
    while True:
        for client, sensor_id in clients:
            # Generate sensor data
            sensor_data = generate_sensor_data(sensor_id)
            payload = json.dumps(sensor_data)


            # Define a unique topic for each client
            topic = f"sensor/data/{sensor_id}"


            # Publish the sensor data to the topic
            client.publish(topic, payload)


        # Wait for one minute before sending the next batch of messages
        time.sleep(60)


except KeyboardInterrupt:
    print("Stopping clients...")
finally:
    for client, _ in clients:
        client.loop_stop()  # Stop the loop
        client.disconnect()  # Disconnect the client
Before running the script, you will need to install the Eclipse Paho library by using the command: pip install paho-mqtt. Please note that some machines require you to run pip3 instead of pip.
After installing the library, run the script: python mqtt-client.py
Note: if you had to use “pip3” instead of “pip,” you may also need to use the “python3” command instead of “python.”
The script will start showing debug information on the screen, like the following:
Connected with result code 0
Message 1 published
Of course, you can interrupt the script’s execution at any moment by pressing Ctrl + C (or Cmd + C for Mac). This action will gracefully disconnect all clients from the broker.
Next, allow the script to run for a few minutes in order to generate data to scrape from Prometheus. Go to the “Connected Clients” section in the Management Center, where you will see all the new clients connected to the broker (Figure 12).
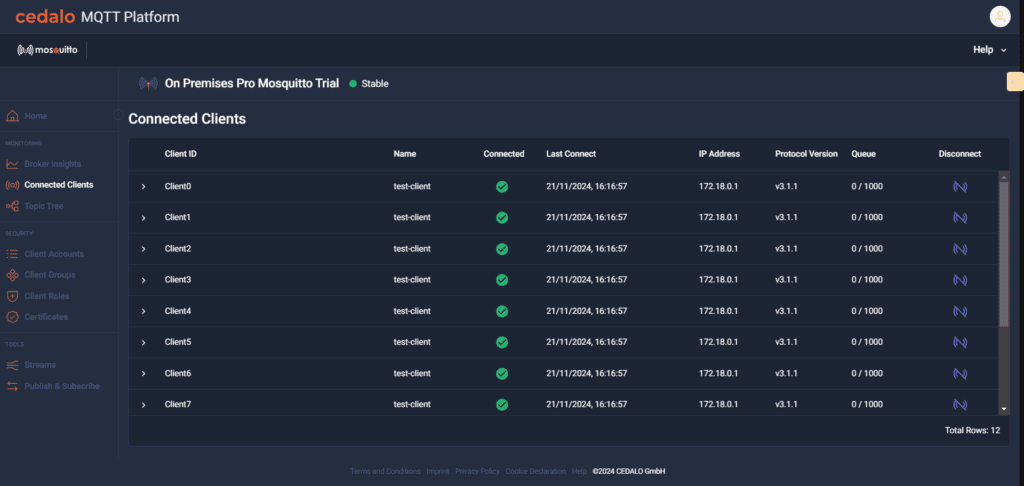
Figure 12 - List of connected clients in the Management Center for Mosquitto via the Cedalo MQTT Platform.
Now, let’s explore the new metrics available in Prometheus.
Showing MQTT metrics in Prometheus
Now that MQTT clients are sending data to the broker, you can explore MQTT messages in Prometheus.
To view the metrics:
1. Go to the Prometheus web interface by pointing your browser to http://127.0.0.1:9090.
2. Then, click on the “world” icon to browse the available metrics.
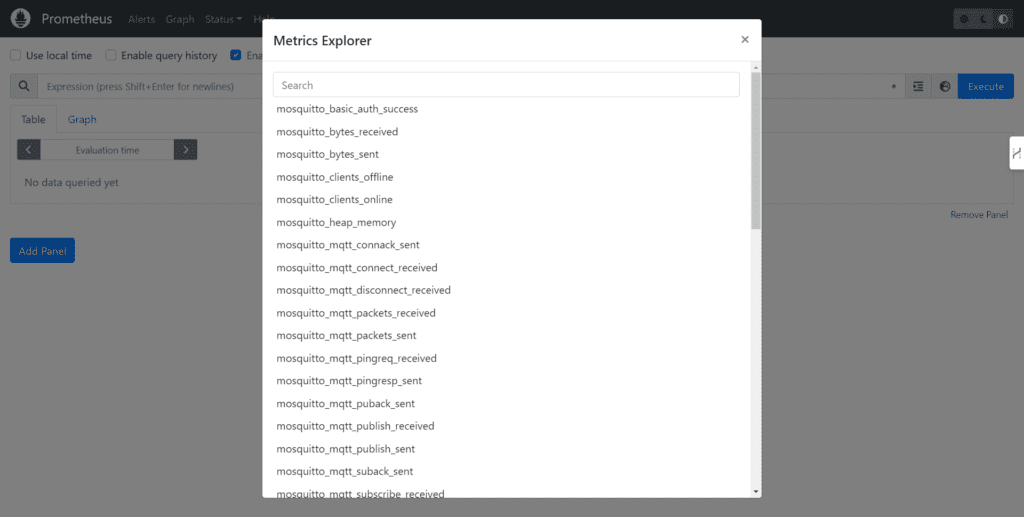
Figure 13 - Exploring the new metrics in the Prometheus web interface.
3. Select any relevant metric from the list, like mosquitto_clients_online. This will display the last values of the metric (Figure 14).
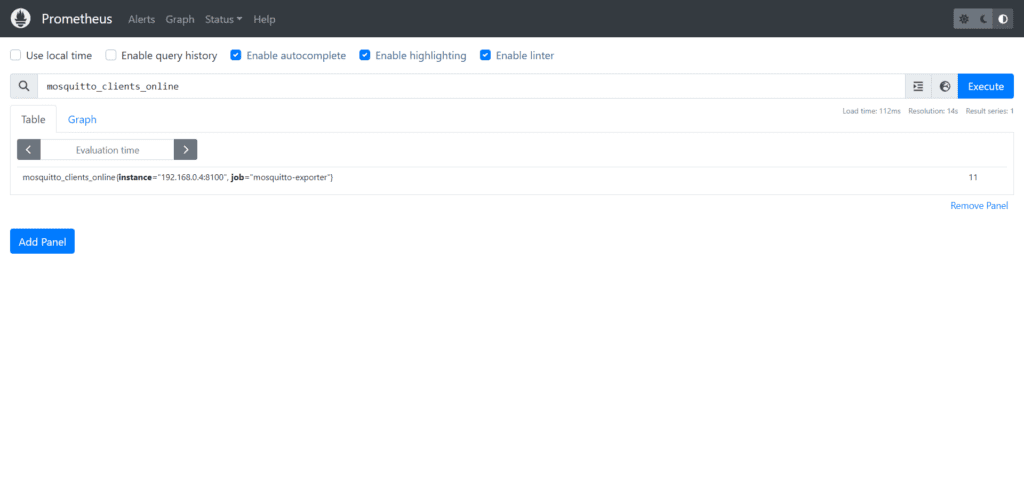
Figure 14 - Showing the last metric values for “mosquitto_clients_online.”
In this case, mosquitto_clients_online metric shows 11 connected clients: 10 artificially generated clients from the Python script and 1 for connecting to the Management Center.
4. Finally, click on the “Graph” tab to visualize the data in a graph (Figure 15).
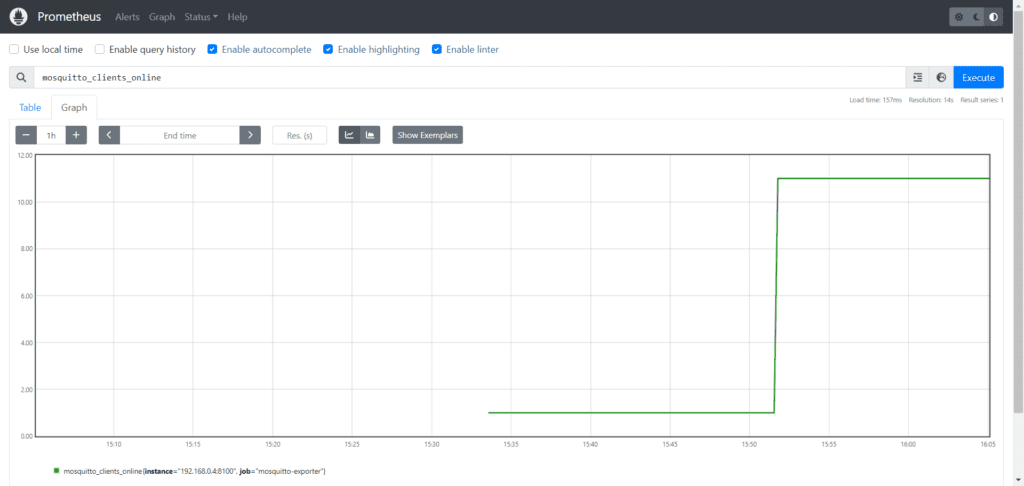
Figure 15 - Visualize “mosquitto_clients_online” metrics graphically.
At this point, you have a system that exposes metrics from the MQTT broker. You can see the complete list of metrics exposed by the exporter through this link.
The most relevant metrics are displayed in the table below.
| Label | Metric type | Description |
|---|---|---|
| mosquitto_sessions | Gauge | Current client sessions (includes offline clients) |
| mosquitto_clients_offline | Gauge | Current offline client count |
| mosquitto_clients_online | Gauge | Current offline client count |
| mosquitto_clients_expired | Gauge | Current clients expired |
| mosquitto_subscriptions | Gauge | Current subscription count |
| mosquitto_retained_messages | Gauge | Current retained message count |
| mosquitto_out_packet_bytes | Gauge | Current queued outgoing packet bytes (includes offline clients) |
| mosquitto_message_store_count | Gauge | Current stored message count |
| mosquitto_pub_bytes_received | Counter | Total PUBLISH payload bytes received |
| mosquitto_pub_bytes_sent | Counter | Total PUBLISH payload bytes sent |
| mosquitto_basic_auth_fail | Counter | Failed username/password authentication attempts |
| mosquitto_basic_auth_error | Counter | Errored username/password authentication attempts |
| mosquitto_extended_auth_fail | Counter | Failed extended authentication attempts |
| mosquitto_extended_auth_error | Counter | Errored extended authentication attempts |
| process_open_fds | Gauge | Number of open file descriptors (including network sockets). |
| process_max_fds | Gauge | Maximum number of allowed open file descriptors (including network sockets). |
| process_cpu_seconds_total | Gauge | Total user and system CPU time spent in seconds. |
| process_resident_memory_bytes | Gauge | Resident memory size in bytes. |
| process_start_time_seconds | Gauge | Start time of the process since unix epoch in seconds. |
Conclusion
This tutorial demonstrates how to export MQTT metrics from Pro Mosquitto to Prometheus for monitoring and analysis. By signing up for a Cedalo MQTT Platform trial, you can leverage Pro Mosquitto’s built-in Prometheus Metrics Exporter with Docker. The set up will enable you to expose broker performance metrics like message rates and client connections for Prometheus to scrape. These metrics are stored in a time-series database, allowing you to query them through the Prometheus web interface.
If you want to know more about MQTT to database integrations, check this guide on MySQL.
With this system in place, you can further leverage the embedded Alertmanager in Prometheus to trigger alerts and notifications. Additionally, the Prometheus time-series database can serve as a data source for other applications and systems, such as Grafana, for further analysis and data visualization.
If you’re looking to create an interactive report to monitor your MQTT data that you gathered in Prometheus, check out this step-by-step “How to build an MQTT dashboard in Grafana” guide.


