
Running a reliable MQTT broker is easy with the Pro Edition for Eclipse Mosquitto™. The pro version of the open-source Mosquitto offers advanced features like enabling the InfluxDB Metrics Exporter plugin.
The plugin allows you to monitor and check metrics such as message data rates, the number of connected clients, potential security threats, and the number of failed authentications. Additionally, this article demonstrates how to configure and use the InfluxDB Metrics Exporter plugin. Lastly, the “Sample Docker deployment” section at the end provides a complete setup, with all the necessary instructions.
Transferring MQTT data from Mosquitto into InfluxDB
Let’s start by using the plugin to export the broker metrics to a database for monitoring. For this purpose, I’ll use InfluxDB, a well-known database for processing time series data, and, optionally, Grafana to visualize the data in dashboards and to enable alerts.
The first step of the setup is to check the prerequisites:
- Ensure a Pro Mosquitto installation is running with version 2.9 or higher. You can request a free Cedalo MQTT Platform trial and choose the on-premises single-node Docker deployment option. (I will assume you are using a PC to run Pro Mosquitto. Refer to the documentation for more details).
- An InfluxDB instance is running. For a quick start, I recommend using a local Docker deployment.
- Optional but recommended: a Grafana instance as an observability platform. You can use your own or a managed version.
The plugin supports InfluxDB versions 1.x and 2.x. Since version 1.x has limited features and lifetime support, use version 2.x for new deployments.
For the InfluxDB Exporter plugin with version 2.x, you will need the following information from your database setup:
- The data ingest endpoint – a URL
- The organization ID – a string
- The bucket name – a string
- A token with write permissions for the targeted bucket – a string
If you choose to use a local Docker deployment for InfluxDB – for a quick start – then the procedure is as follows.
To begin, extend the docker-compose.yml with the following lines (please refer to the “Sample Docker deployment” section):
 influxdb:
        image: influxdb:2
        environment:
            - DOCKER_INFLUXDB_INIT_ADMIN_TOKEN=xp9Vh93pZbeMDbsoQsA
            - DOCKER_INFLUXDB_INIT_MODE=setup
            - DOCKER_INFLUXDB_INIT_USERNAME=admin
            - DOCKER_INFLUXDB_INIT_PASSWORD=admin4cedalo
            - DOCKER_INFLUXDB_INIT_ORG=devteam
            - DOCKER_INFLUXDB_INIT_BUCKET=mosquitto
        ports:
            - 8086:8086
        volumes:
            - ./influxdb:/var/lib/influxdb2
            - ./influxdb:/etc/influxdb2
Then, start the new container with:
docker compose up -dThis command will pull the InfluxDB docker image from the docker hub, create a directory named ‘influxdb’ in your PC’s current working directory, and start InfluxDB. Then, the ‘influxdb’ directory will store the data and configuration.
The InfluxDB setup is now finished with the following information:
- Data ingest endpoint: http://influxdb:8086
- Organization: devteam
- Bucket: mosquitto
- Token: xp9Vh93pZbeMDbsoQsA (shortened example)
You will need this information for the Mosquitto configuration in the next section. The InfluxDB instance is only an example, so you can replace it with any other self-hosted or managed version. However, the settings and steps to get the necessary information may differ.
Pro Mosquitto to InfluxDB configuration
Pro Mosquitto provides an InfluxDB exporter that exposes the metrics available in the core broker and any metrics provided by other plugins. To enable and configure this plugin, you will need to edit your running Pro Mosquitto configuration file. Additionally, Pro Mosquitto offers a built-in Prometheus Metrics Exporter that sends MQTT broker metrics to Prometheus. For full instructions, explore this dedicated guide.
In the Mosquitto configuration file mosquitto.conf, add these lines to the end of the file and save it:
global_plugin /usr/lib/cedalo_metrics_influxdb.so
plugin_opt_update_interval 60
plugin_opt_host http://influxdb:8086
plugin_opt_organisation devteam
plugin_opt_bucket mosquitto
plugin_opt_token xp9Vh93pZbeMDbsoQsA
Note: Be sure to update all values with your own specific values (see the previous section).
The plugin_opt_update_interval option defines the interval (in seconds) at which the Broker instance will send all metrics to the specified data ingest endpoint. The ingest endpoint is a URL with a scheme, hostname, and port and is set with the plugin option plugin_opt_host. For a complete reference on the plugin options, please refer to this documentation.
How to test the Pro Mosquitto MQTT broker and InfluxDB integration
After updating the Mosquitto configuration, restart the broker with the command:
docker compose restartWhile the broker is starting up, you can observe the correct loading of the plugin in the log output. Figure 1 shows a possible output of these logs. You can retrieve the logs with the command:
docker compose logs mosquittoTo see the information about the plugin, ensure that the log level of your Mosquitto instance is set to at least ‘information.’ Use the configuration option: log_type information in the mosquitto.conf file to set the log level. The screenshot in Figure 1 shows the log for successfully loading the InfluxDB plugin.
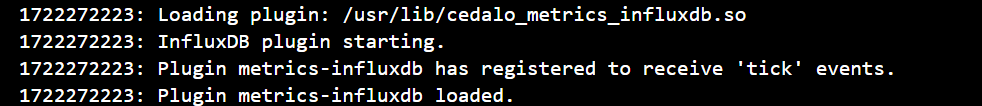
Figure 1 - Screenshot of a possible log output after successfully loading the InfluxDB Exporter plugin.
In case of any plugin issues, the log output will give useful hints for solutions:
- InfluxDB: Couldn’t resolve hostname → check the URL, DNS resolution, or Internet connection of the broker
- InfluxDB: 401 error in response → check if your token is correct and has the right “write” permission.
- InfluxDB: 404 error in response → check whether the ‘mosquitto’ bucket configuration exists.
- InfluxDB: 404 error in response → check whether the ‘devteam’ organization configuration exists.
If there are no problems in the logs, the broker will send the metrics to InfluxDB.
To check that the data is stored in the database, open the webUI of the InfluxDB instance (http://localhost:8086), log in with the credentials from the docker-compose.yml file (admin/admin4cedalo), and check for the data in the bucket named ‘mosquitto.’ Figure 2 shows the steps to verify this information.
Depending on the version and type of influxDB you are using, the screen may differ from Figure 2, but the main steps are: Explore → Bucket → Measure → Fields → Run. In the output area, there will either be a table or a graph displaying the values. The list of available fields also indicates the correct functionality of the exporter plugin. You can refer to this list for all available metrics.
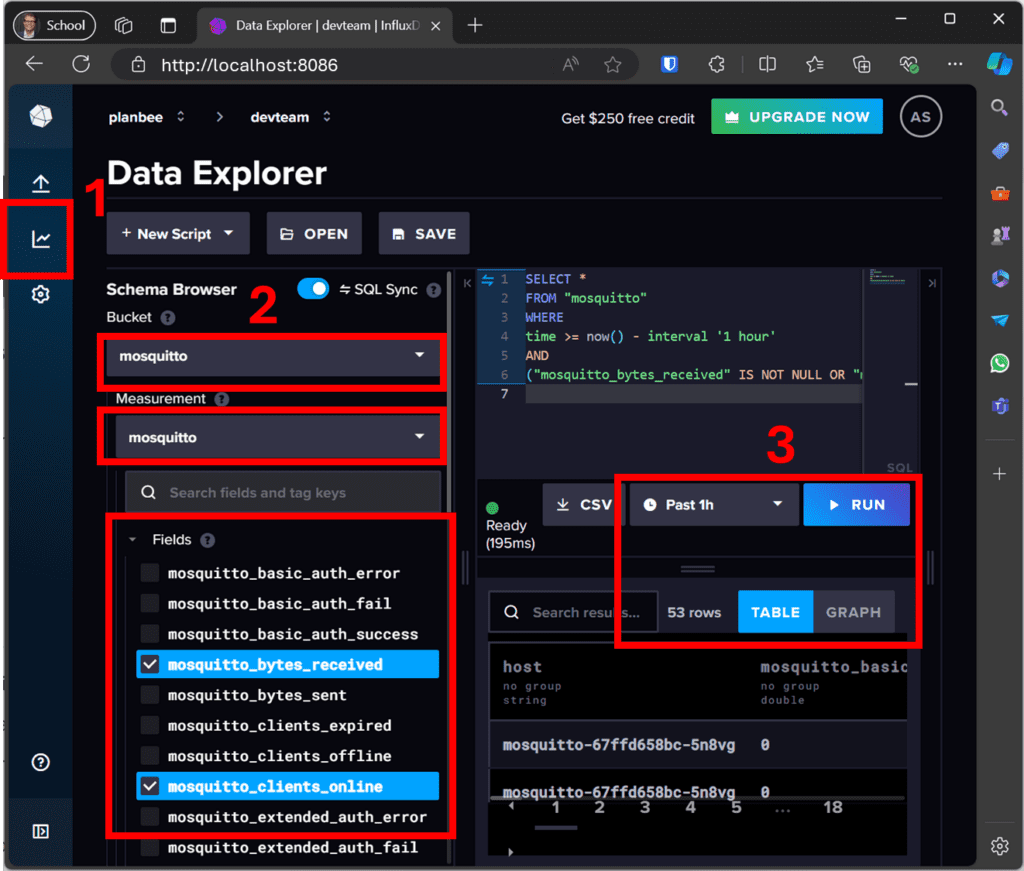
Figure 2 - Data Explorer view for an InfluxDB 2.0 instance, showing the stored metrics from the Mosquitto broker. The screen may differ depending on the version and type of influxDB used.
Best practices for using MQTT data in InfluxDB
This section shows a best practice use case for utilizing the stored metrics data from the Pro Mosquitto broker. The setup shown uses the on-premises trial license in a docker deployment. Moreover, Grafana can display the data from the InfluxDB data source to create a valuable dashboard. To proceed, add the following lines to extend the docker-compose.yml file (refer to the “Sample Docker deployment” section in this article):
    grafana:
        image: grafana/grafana:latest
        ports:
            - 3000:3000
Then start the additional container with:
docker compose up -dAs a result, this will start a Grafana instance accessible under the URL: http://localhost:3000 using the initial credentials login: admin password: admin.
This application allows you to arrange the data in a dashboard (see Figure 4). To connect the Grafana dashboard to the InfluxDB database, you need to configure a data source in Grafana.
In essence, you will need the same information as the Pro Mosquitto Metrics Exporter plugin (URL, organization, bucket, token). Figure 3 shows the settings for using InfluxDB as a data source for dashboards. First, create a new ‘connection’ and add ‘InfluxDB’. Then, enter the specific information mentioned before. You can refer to the documentation for InfluxDB data sources in Grafana, here.
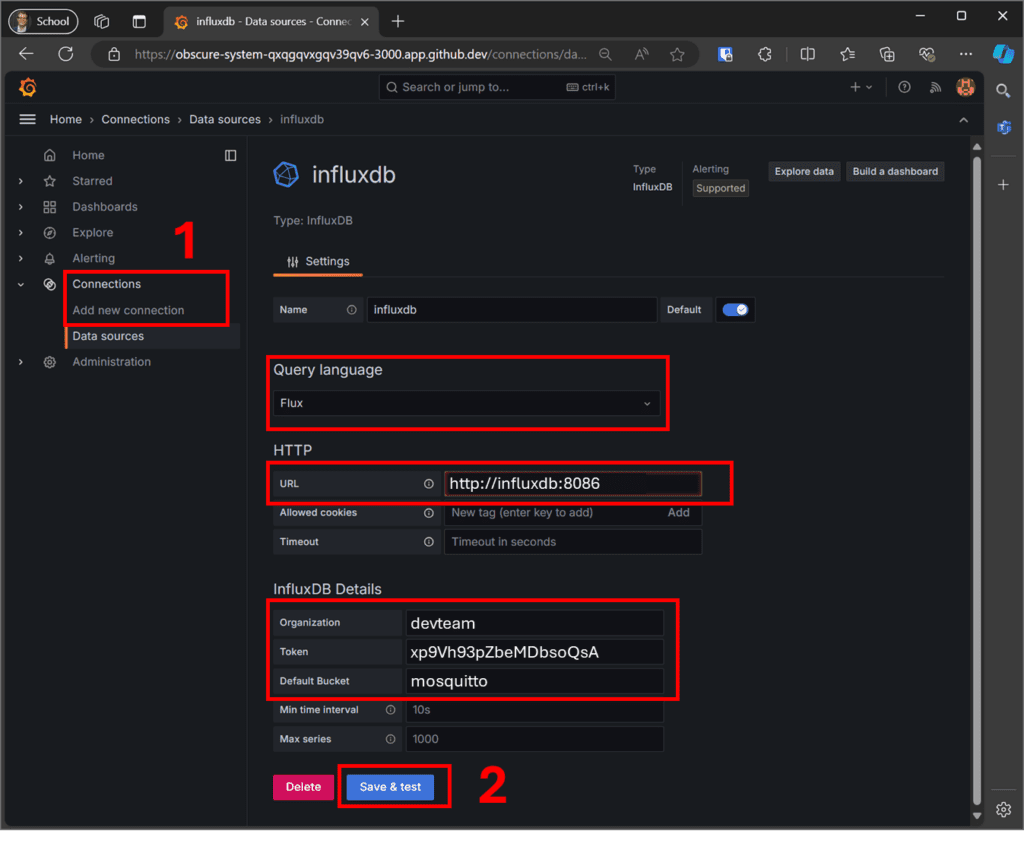
Figure 3 - Procedure to create a new ‘connection’ to use the InfluxDB as a data source for a dashboard.
The example dashboard in Figure 4 shows two metrics: “Clients online” and “Messages retained.” To display the metrics, the query in Grafana is as follows:
from(bucket: "mosquitto")
  |> range(start: v.timeRangeStart, stop: v.timeRangeStop)
  |> filter(fn: (r) => r == "mosquitto")
  |> filter(fn: (r) => r == "mosquitto_clients_online")
  |> group()
The bar chart in Figure 4 shows derived values from the ‘bytes sent’ and ‘bytes received’ metrics. The query takes advantage of InfluxDB’s advanced time series processing capabilities and may look like this:
from(bucket: "mosquitto")
  |> range(start: v.timeRangeStart, stop: v.timeRangeStop)
  |> filter(fn: (r) => r == "mosquitto")
  |> filter(fn: (r) => r == "mosquitto_bytes_received")
  |> aggregateWindow(every: 1h, fn: max, createEmpty: false)
  |> timeShift(duration: -1h,columns: )
  |> difference(nonNegative: false, columns: )
  |> map(fn: (r) => ({r with _value: r._value  / 60.0 * 1.0}))
  |> yield(name: "received")
An alert rule monitors these values (data rates) and triggers a notification message when a threshold is exceeded.
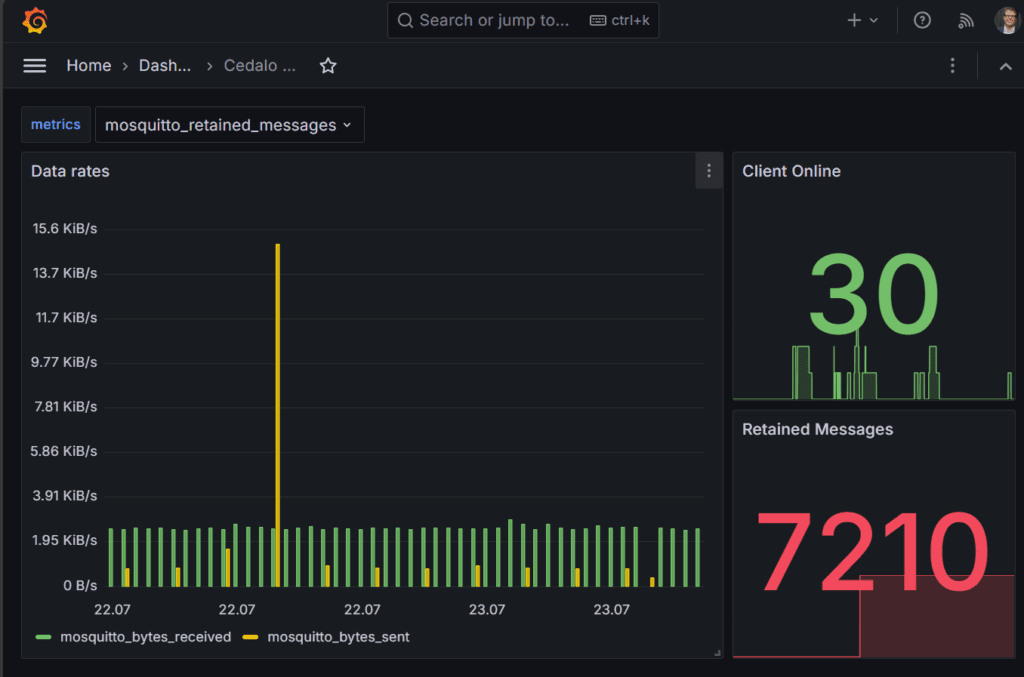
Figure 4 - Dashboard example displaying broker metrics: bytes sent, bytes received, clients online, and retained messages.
Figure 5 illustrates how to create alert rules based on the stored metrics. In the case shown, a threshold is set to alert when data rates exceed 10 kbytes per second. You can use notification channels such as email, Discord, or Slack for alerts. Furthermore, you can refer to the Grafana documentation for more details on setting up alert rules and notification policies.
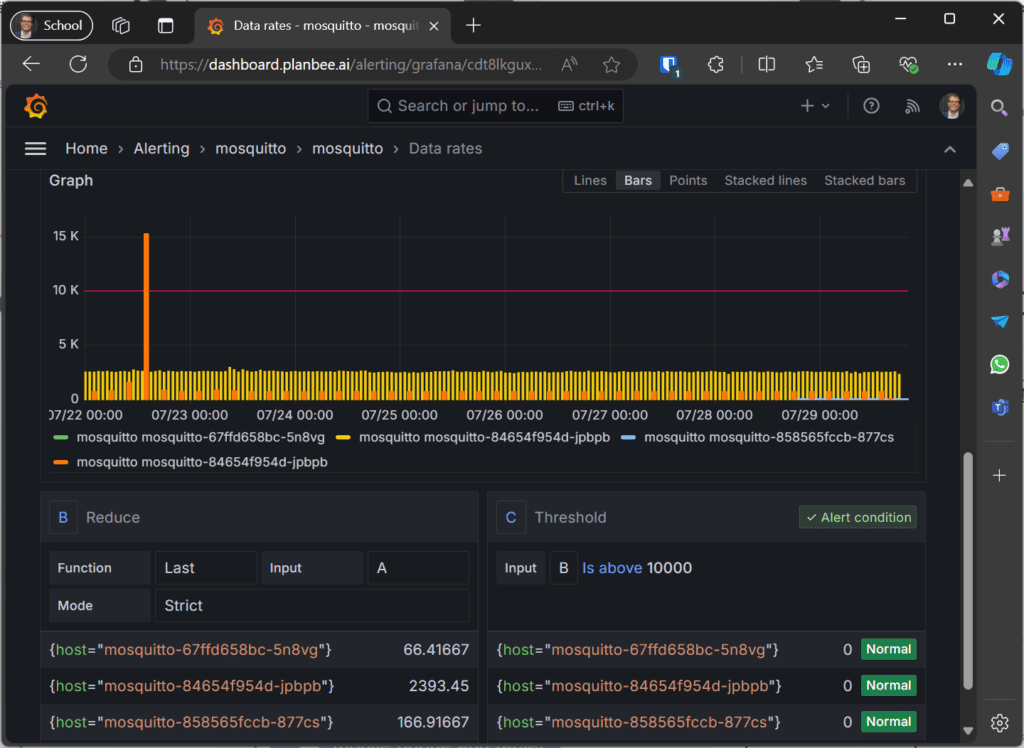
Figure 5 - The alert rule set up to notify about data rates higher than a certain threshold.
Sample Docker deployment
After requesting a free Cedalo MQTT Platform trial, you will receive an email with the necessary information.
Download the setup (select “Download all”) via the link in the email. Additionally, you can refer to this short tutorial to get started with the docker environment.
Below is the main docker-compose.yml file mentioned throughout this article:
services:
 mosquitto:
   image: registry.cedalo.com/mosquitto/mosquitto:2.9
   ports:
     - 1883:1883 # MQTT no TLS
     - 8883:8883 # MQTT with TLS (needs to be configured in mosquitto.conf)
     - 8090:8090 # Websocket no TLS (needs to be configured in mosquitto.conf)
   networks:
     - cedalo-platform
   environment:
     CEDALO_LICENSE_FILE: /mosquitto/license/license.lic
   volumes:
     - ./mosquitto/config:/mosquitto/config
     - ./mosquitto/data:/mosquitto/data
     - ./management-center/config/:/mosquitto/license/
 influxdb:
   image: influxdb:2
   environment:
       - DOCKER_INFLUXDB_INIT_ADMIN_TOKEN=xp9Vh93pZbeMDbsoQsA
       - DOCKER_INFLUXDB_INIT_MODE=setup
       - DOCKER_INFLUXDB_INIT_USERNAME=admin
       - DOCKER_INFLUXDB_INIT_PASSWORD=admin4cedalo
       - DOCKER_INFLUXDB_INIT_ORG=devteam
       - DOCKER_INFLUXDB_INIT_BUCKET=mosquitto
   ports:
       - 8086:8086
   volumes:
       - ./influxdb:/var/lib/influxdb2
       - ./influxdb:/etc/influxdb2
   networks:
     - cedalo-platform
 grafana:
   image: grafana/grafana:latest
   ports:
       - 3000:3000
   networks:
     - cedalo-platform
 management-center:
   image: registry.cedalo.com/mosquitto/management-center:2.9
   ports:
     - 8088:8088
   expose:
    - 8088
   depends_on:
     - mosquitto
   networks:
     - cedalo-platform
   environment:
     CEDALO_HOST_NAME: ${CEDALO_HOST_NAME}
     CEDALO_MC_PROXY_HOST: 0.0.0.0


     CEDALO_MC_USERNAME: cedalo
     CEDALO_MC_PASSWORD: mmcisawesome


     CEDALO_MC_PROXY_SRT_BASE: /management-center/config
     CEDALO_MC_LICENSE_PATH: /management-center/config/license.lic


     # CEDALO_MC_PLUGIN_LIST_PATH: /management-center/config/plugins.json
     CEDALO_MC_PROXY_CONFIG: /management-center/config/config.json
     CEDALO_MC_PROXY_CONFIG_CERTS: /management-center/config/certs.db
     CEDALO_MC_PROXY_CONFIG_TOKENS: /management-center/config/tokens.json
     CEDALO_MC_PROXY_CONFIG_USERS: /management-center/config/users.json
     CEDALO_MC_PROXY_CONFIG_AUDIT_TRAIL: /management-center/config/audit.json
     CEDALO_MC_BROKER_CONNECTION_MQTT_EXISTS_MAPPING: mosquitto:true
     CEDALO_MC_BROKER_CONNECTION_MQTTS_EXISTS_MAPPING: mosquitto:false
     CEDALO_MC_BROKER_CONNECTION_WS_EXISTS_MAPPING: mosquitto:false
     CEDALO_MC_BROKER_CONNECTION_HOST_MAPPING: mosquitto:localhost


     CEDALO_MC_DATA_DIRECTORY_PATH: /management-center/config


     CEDALO_MC_MODE: offline
   volumes:
     - ./management-center/config:/management-center/config
     # map unix socket for audit trail:
     - /dev/log:/dev/log
   command: >
     /bin/sh -c "
       while ! nc -z mosquitto 1883;
       do
         echo 'Waiting for mosquitto';
         sleep 1;
       done;
       cd /management-center; exec ./mmc
     "
networks:
 cedalo-platform:
   name: cedalo-platform
   driver: bridge
Wrap-up
Using the InfluxDB Metrics Exporter plugin from Pro Edition for Eclipse Mosquitto offers a highly reliable and effortless way to monitor and observe the performance, functionality, and security of the MQTT broker.
You can use a cloud-managed InfluxDB instance or your self-hosted instance to store the metrics. Enabling and configuring the plugin is as simple as adjusting the configuration file and restarting the broker.
Grafana allows you to create valuable dashboards and enable powerful notification and alerting rules. These features keep you informed about key metrics or potential problems with the MQTT broker from anywhere. You can test and evaluate all the setups using the Pro Mosquitto MQTT Broker version 2.9 or higher, click here to get started.


