
MQTT is a common protocol for Internet of Things (IoT) communication, where devices connect to an MQTT broker and transfer messages using the publish/subscribe model.
Professional MQTT server setups often require managing numerous client connections and high data rates. As a result, the scalability and performance of an MQTT broker are crucial for any IoT solution.
In this tutorial, you will learn to test the functionality and performance of the Mosquitto MQTT broker using various tools.
Metrics to test a Mosquitto MQTT broker
The aim of designing a test plan for network or data-based services is to verify or derive the performance of the MQTT broker or digital service.
- One performance metric could be the average response delay time under specific load conditions defined by the number of client connections and MQTT message transport in bytes/second.
- Another metric could be the time it takes, including the time for the transport over the internet, for one client to connect to the broker, publish a message, and receive the acknowledgment (PUBACK).
- Additionally, another testing criterion could be to verify access to different topics for different client credentials.
Software tools to test the Mosquitto MQTT broker
To perform this testing, you need software tools to simulate many client connections and messages at random points in time and possibly connect to the broker from different WAN regions.
- Command line clients offer the simplest approach to test connections and topic access. Several tools available: the first choice is using Linux mosquitto-clients, while Windows users can opt for MQTTX-CLI.
- Emqtt_bench is an open-source command line application that allows you to simulate connections and loads for thousands of clients. It can be a fundamental component for creating custom test scripts that run on multiple real or virtual computer instances. While using this tool, it is possible to simulate thousands of client connections, but it may not be as easily managed as with JMeter.
- JMeter is another open-source performance testing tool with a GUI written in Java and is highly cross-compatible. It can simulate thousands of client connections and automatically create reports, and developers widely use it for load testing of various web services.
There are also fully managed web tools or test suites that use either Emqtt bench or JMeter as core components.
Testing MQTT connection and topic access on the command line
Start by installing the mosquitto-clients with the following commands on Linux/Ubuntu:
sudo apt update && sudo apt install -y mosquitto-clientsThis will install the Mosquitto command line client applications, enabling you to test MQTT connections and topic access.
One basic command to start is as follows:
mosquitto_pub -d -L mqtt://rw:readwrite@test.mosquitto.org:1884/testopic/test -m "Hello"This command includes major options and functionalities:
- The URI, which is set with the command argument “-L,” has the following scheme:
For example: mqtt://rw:readwrite@test.mosquitto.org:1884
- The topic to publish to is set as a path extension of the URI:
/ .
In the example above: testopic/test.
- Finally, the payload–the message to publish–is set using the “-m” argument. In the example above, the payload is “Hello.”
By adjusting the values, you can test various aspects of the connection and topic access, such as enabling or disabling TLS, changing the username/password, and publishing to different topics.
To see all possible options, execute the commands mosquitto_pub or mosquitto_sub followed by “—help.”
On Windows, download the MQTTx-CLI from here, rename the downloaded file to “mqttx.exe,” and execute it from the command shell.
In principle, this command line tool works like the mosquitto client tool but has the capability to connect via Websockets and includes a straightforward benchmark option.
Here is the basic command with the most common options:
mqttx.exe pub -h test.mosquitto.org -p 8090 -V 3.1.1 -l ws
-u rw -P readwrite --debug -t testopic/test -m "Hello"
This command connects via Websocket (argument “-l”) and publishes a message on the public Mosquitto test broker. On test.mosquitto.org, you can read about different prepared broker ports to test and get familiar with the command line clients.
The most common tests will be:
- Connect by the given domain or IP address and port
- Authenticate with username and password
- Check the access to specific topics with the use credentials
Possible issues for these basic tests can be classified into three categories:
- Connection is not possible, Timeout: Check firewall rules, possible proxy requirements, and the connection to the broker itself by using the ping command
- Authentication rejected, not authorized to connect: Check username, password, and possible requirements to provide a certificate for the client.
- Subscription or Publication is not possible: Check if the client identified by the credentials and client id has access to the targeted topic.
You can use these simple command line tools to check the basic functionality of the broker. In the next section, I’ll describe one possible setup for carrying out professional load testing on the MQTT broker.
MQTT load testing using JMeter
MQTT brokers in productive environments handle thousands of client connections and process high message volumes. For reliable service delivery, it is essential that delays are predictable and message rates remain consistent. Load testing over time can help document these key performance metrics. Testing many client connections and messages from a single instance using client tools is straightforward and can be done with simple command line tools.
However, multi-region and widespread client geolocations require a more complex approach. One method is to develop a test plan locally and deploy it with load test clients on virtual machines via Docker containers. The following sections describe how this can be done with the JMeter tool.
JMeter installation and usage on Windows
In this section, I explain how to install and use JMeter on a Windows PC. This tutorial focuses on testing the open-source version of Mosquitto, but you can sign up for a Cedalo MQTT Platform trial to explore advanced features available in the Pro Edition for Eclipse Mosquitto™ MQTT broker.
To begin, install JMeter on Windows by following these steps:
- Download the zip archive (a higher version may be available in the future).
- Unpack the archive and browse the folder.
- Download the MQTT protocol extension (a higher version may be available in the future).
- Move or copy the MQTT extension to the
lib\extfolder within the JMeter directory (see Step 2.) - In the bin folder of the JMeter directory, double-click the
jmeterw.cmdfile and wait a few seconds. A window will pop up, and the application will be ready.
MQTT extension loading verification
To verify whether you loaded the MQTT extension correctly, download a JMeter test plan file by right-clicking on the link: first_test.jmx (the file extension is jmx). Then, select Save as.
In the JMeter GUI, select File from the menu, choose Open, and then select the downloaded file.If you successfully load the MQTT extension in JMeter, you will see a screen similar to Figure 1.
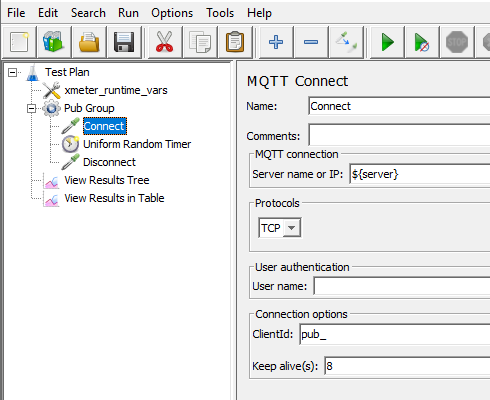
Figure 1 - View of the JMeter GUI with a successfully loaded sample MQTT test plan
If the MQTT plugin is not found or fails to load correctly, the following message (Figure 2) will appear after opening the test file.
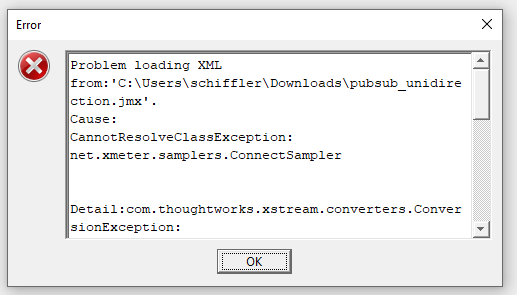
Figure 2 - _Example view of the JMeter GUI in case of the MQTT extension loading failur_e____
To solve this issue, check the following:
- There is the
mqtt-xmeter-fuse-2.0.2-jar-with-dependencies.jarfile in the%JMETER_HOME%\lib\extdirectory, which you can download here. - When you double-click on the
jmeterw.cmdfile in the%JMETER_HOME%\bindirectory (Windows OS), JMeter will be launched.
Creating a simple Mosquitto test plan
Start with an easy procedure to familiarize yourself with the JMeter interface and develop a simple Mosquitto test plan.
There are several steps:
- Connect to an MQTT broker with enabled TLS encryption for the data transport (use MQTT protocol version 3.1.1). Sign up for the Cedalo MQTT Platform to test advanced Pro Mosquitto MQTT broker functionalities alongside the Management Center for Mosquitto web UI.
- Complete authentication with username and password
- Publish a MQTT message on any topic
- Disconnect from the broker
Opening the JMeter GUI for the first time automatically creates an empty test plan.
First of all, you must create a thread group to define the steps noted above. A thread group is a fundamental element of a test plan in JMeter. It controls the number of threads that JMeter uses to execute a test. You can use multiple threads to simulate concurrent broker connections. To add a thread group, right-click the test plan in the tree view on the left, choose Add, and select Thread group. For simplicity, do not change the default parameters to ensure only one thread will start.
According to the simple test plan above, you should first add the MQTT Connect action. JMeter calls these types of actions as samplers. To add a sampler, right-click the thread group, choose Add, and select the MQTT Connect sampler. Then, configure the connect parameters in the dialog that opens on the right. Edit the following parameters according to your setup or needs: the broker address, port number, username, password, protocol version, and the setting for the TLS encryption. For more information on configuring TLS/SSL on the Mosquitto MQTT broker, refer to this article.
In the same way, add an MQTT Pub Sampler, which will publish a message defined by the parameters in the dialog. Here, you can set the topic to publish the MQTT message to the quality of service (QoS) level, and the message/payload itself.
Now, add the MQTT Disconnect sampler to ensure disconnection from the broker after running the test. It is important to note that the order of the samplers in the tree view will determine the order in which the actions execute.
As a final component, you need a listener to collect and save the test results. To add such a listener to our test plan, right-click the test plan, choose Add, then Listener, and add the View Results Tree listener. In the component’s parameters, specify the filename and location on your local disk to save results. For example, set the filename and location to C:\users\admin\documents\test-plan-report.jtl (the JMeter result file has the extension jtl.)
The screen of the JMeter GUI will look like the example shown in Figure 3. If you need help creating this test plan, you can download it here and load it to the JMeter GUI via the menu file and an open file dialog.
Now, you can run the test plan by clicking the green play button in the GUI. If this is not the first test run, the application will ask if you want to append or overwrite the result file. After the test finishes, if the green Play button in the menu bar is visible, it indicates that the test has produced some results. Click/open the result listener to see an overview of the executed steps (see Figure 3) – red for fail and green for success. To create a featured test plan report with dashboards, graphs, and metrics from the result file, rerun JMeter with two options from the command line.
To create an HTML report from the result file, run the following command line:
jmeter -g C:\users\admin\documents\test-plan-report.jtl -o C:\users\admin\documents\reportsIn this command line, the parameter after the -g option is the filename of your result file set in the result listener. The -o option defines the location where the HTML report will store on disk. After the command line’s execution, open the location specified after the -o option, and you will see some files and folders. Now, open the index.html file in a browser and see the report page similar to the one shown in Figures 8 and 9.
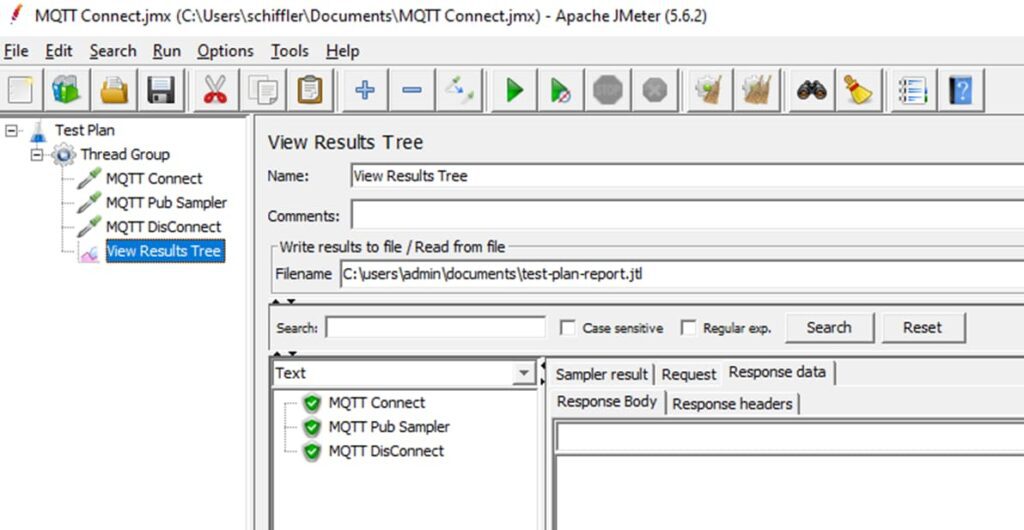
Figure 3 - View of the JMeter GUI after creating an MQTT test plan with an open view of the result tree
JMeter scripting and automation
Consider the following actions when testing an MQTT server using JMeter:
- Test different user credentials,
- Test MQTT connections with or without TLS-encrypted transport,
- Simulate loads,
- Test access control lists for users/clients subscribing or publishing on specific topics.
Two elements that make the test plan more programmatic and flexible are:
- User Parameters that define one of many different credentials to establish a connection.
- User Defined Variables that define general variables such as the broker address or port number.
You can add these two elements to the thread group by right-clicking the group and selecting Add, then choosing the pre-processor to add user parameters or the config to add the user-defined parameters.For example, in the user-defined parameters, set the broker address and the port number. Then, you can use these parameters in the MQTT connect sampler by referring to them in a special syntax with the following pattern: use ${<NAME>} in the settings dialog and replace <NAME> with the name of the parameter. See Figure 4 for a visual representation of this.
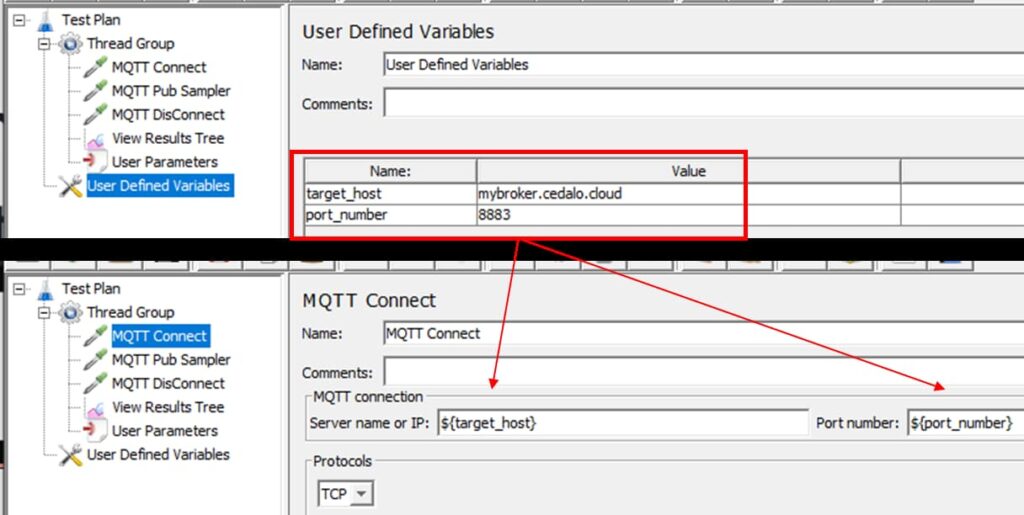
Figure 4 - View of different configuration dialogs showing the capability to use user-defined variables to set the broker address and port number
You can use these or other user-defined parameters in any setting dialog. For example, to specify the topic, the message payload, or the MQTT client ID.
The other element, also visible in Figure 4, is the user parameters element, which holds the information about which user – which credentials – the thread group will use.
JMeter can start multiple threads in a thread group, with each thread running with a different user. If you want to do this, first increase the number of threads to 500. Then, uncheck the thread group option “Same user on each iteration” and define five users (username and password). JMeter ramps up 500 threads and uses the specified credentials. After starting the fifth thread, JMeter will use the first user credentials for thread six because there are more threads than users defined. To see an example, refer to Figure 5.
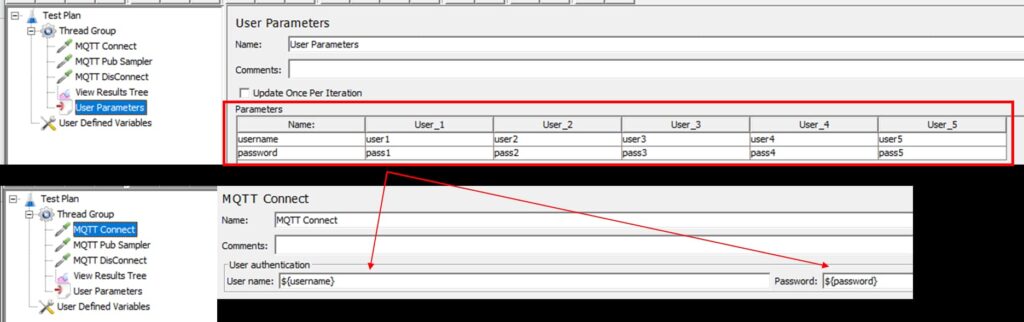
Figure 5 - View of two different settings dialogs in the JMeter GUI, highlighting the option to use different credentials in multiple threads
Two other elements control the test sequence:
- The Loop controller repeats a set of samplers or requests for the number of times specified in the test step.
- The timer waits for a specified constant or a random time within a defined time range.
These two elements are also basic building blocks to simulate a stochastic load resulting from many MQTT connections publishing messages on different topics, as shown in the tree view of such a test plan in Figure 6.
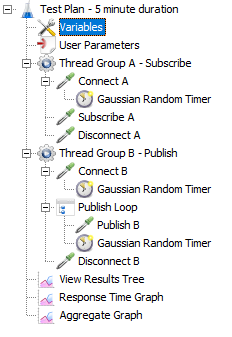
Figure 6 - A sample MQTT test plan in the tree view of the JMeter GUI
In more advanced test automation use cases, you can start the test plan from the command line and set the properties by providing them as arguments on the command line.
For example, the command line starts the test plan defined by the my-advanced-plan.jmx file and sets the property TARGET_PORT to 1884:
jmeter -n -t c:\users\admin\documents\my-advanced-plan.jmx -JTARGET_PORT=1884To use this property, define the variables in the test plan, as shown in Figure 7. The pattern is ${__P(<PROPERTY_NAME>,<DEFAULT>)}. Then, replace the <PROPERTY_NAME> with a name value. This name will be used on the command line with the -J option. I recommend using only capital letters to denote that this information is set via command line arguments.
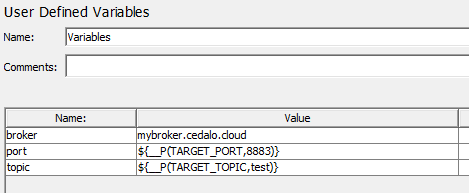
Figure 7 - Cropped view of the user-defined variables in the JMeter GUI which use the properties defined via command line arguments
Using JMeter with MQTT extension on Docker to test Mosquitto
The sections above describe the basic steps to create and automate a test plan.
If you want to start testing immediately, use ready-made test plans that you can customize via the command line. For example, you can download one such test plan here, as shown in Figure 6.
Alternatively, you can execute it in the virtual environment (github codespace). This git repository includes a Dockerfile that you can use to build a container to call and run JMeter from the command line.
If you install JMeter with the MQTT extension, you can perform the following steps:
- Clone the repository with the ready-made test plan and test environment. This will create a “docker-jmeter-server” directory, which will contain a test plan:
git clone https://github.com/aschiffler/docker-jmeter-server- Navigate to the created directory:
cd docker-jmeter-server- Start the default test plan (requirement: JMeter is locally available on the Windows machine where you run the following command line):
jmeter -n -t tests\mqtt\sub_pub.jmx -e -l test-plan.jtl -o .\report-dir- Start the test with custom variables (
Windows cmdcommand). Note that the property values in the command below are just example placeholders. To run these tests, you should have a running broker (locally or on the cloud) with two configured users (more about this test plan configuration is explained below):
jmeter -n -t tests\mqtt\sub_pub.jmx -e -l test-plan.jtl -o .\report-dir ^
-JTARGET_HOST=mybroker.cedalo.cloud ^
-JTARGET_PORT=1883 ^
-JUSER1=foo -JPASS1=secret1 ^
-JUSER2=bar -JPASS2=secret2 ^
-JTHREADS_SUB=20 -JTHREADS_PUB=20 -JTOPIC=test- Start the test with custom variables (if run it in this github codespace):
jmeter -n -t tests/mqtt/sub_pub.jmx -e -l test-plan.jtl -o ./report-dir \
-JTARGET_HOST=mybroker.cedalo.cloud \
-JTARGET_PORT=1883 \
-JUSER1=foo -JPASS1=secret1 \
-JUSER2=bar -JPASS2=secret2 \
-JTHREADS_SUB=20 -JTHREADS_PUB=20 -JTOPIC=test
Alternatively, you can launch JMeter as a Docker container by calling the run.sh script file that starts the roschi/jmeter-mqtt:5.6 Docker container from dockerhub.com. This container version already holds the required JMeter application and the MQTT extension (using: bash shell and Linux OS):
./run.sh -n -t tests/mqtt/sub_pub.jmx -e -l test-plan.jtl -o ./report-dir \
-JTARGET_HOST=mybroker.cedalo.cloud \
-JTARGET_PORT=1883 \
-JUSER1=foo -JPASS1=secret1 \
-JUSER2=bar -JPASS2=secret2 \
-JTHREADS_SUB=5 -JTHREADS_PUB=500 -JTOPIC=test
It’s possible to use the repository’s sub_pub.jmx Mosquitto test plan out of the box or modify it. The plan defines two thread groups. One for executing subscriptions to a topic, and another for publishing messages to a topic in a loop with a random wait time. The number of threads in each group can be defined via command line arguments THREADS_SUB and THREADS_PUB. The specific topic is defined via TOPIC.
Use three user credentials, independently of the number of threads. Two of them can be passed via the arguments USER1/PASS1 and USER2/PASS2. Leave the third empty to test whether anonymous access is possible.
The command line call above also defines the report directory. The filename test-plan.jtl defines the result file.
The test plan uses two known client credentials and one anonymous client to make requests to Mosquitto. Before running the plan, create these two clients on the broker and disable anonymous access.
Additionally, publish and subscribe access to one specific topic (defined by -JTOPIC) should be granted only for one client account. The other client should only be able to subscribe. You can achieve the last steps with the help of the Mosquitto dynamic security plugin.
After a test run, the tool creates a report in the form of an HTML file in the report directory. If you use the ready-to-run codespace, you can start an HTML live server. Click the Go Live button in the lower information pane of the codespace environment. This will open the report in your browser.
Sample MQTT server test results
The sub_pub.jmx test plan for Mosquitto from this repository shows that if everything is correctly configured, both clients can connect to the broker. But only one client can subscribe or publish. In Figures 8 and 9, you can see two sample screenshots from the JMeter HTML report page. The figures present summarized information. Some portion of the test cases fail. The configuration disables anonymous access and prevents one set of credentials from publishing on the specified topic.
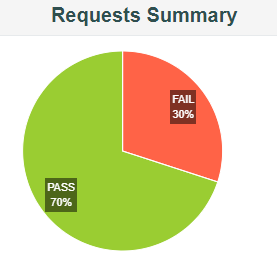
Figure 8 - Cropped view of the summary page of a test plan result automatically created by JMeter
| Type of error | Number of errors | % in errors | % in all samples |
|---|---|---|---|
| 500/Publish: Connection not found. | 9 | 42.86% | 12.86% |
| 500/Subscribe failed because the connection is not established. | 3 | 14.29% | 4.29% |
| 500/Connection not found. | 3 | 14.29% | 4.29% |
Fig. 9 Cropped view of one of the statistics table views created from the test plan result file by JMeter
Wrap up
This tutorial uses JMeter to demonstrate the Mosquitto testing process with multiple client connections, different credentials, and actions (subscribe/publish).
Additionally, I provide instructions on how to use a ready-made test plan in a local environment or any virtual instance by using JMeter in a Docker container.


