
In a previous blog posts I demonstrated how to set up a Streamsheet that controls a industrial machinery. I you haven’t read this previous post you might consider reading it before continuing with this new post.
In this blog post I will extend the Streamsheet application to serve as an analytical dashboard for the industrial machinery introduced in the previous blog post. The following screenshot gives a quick graphical impression of the dashboard.
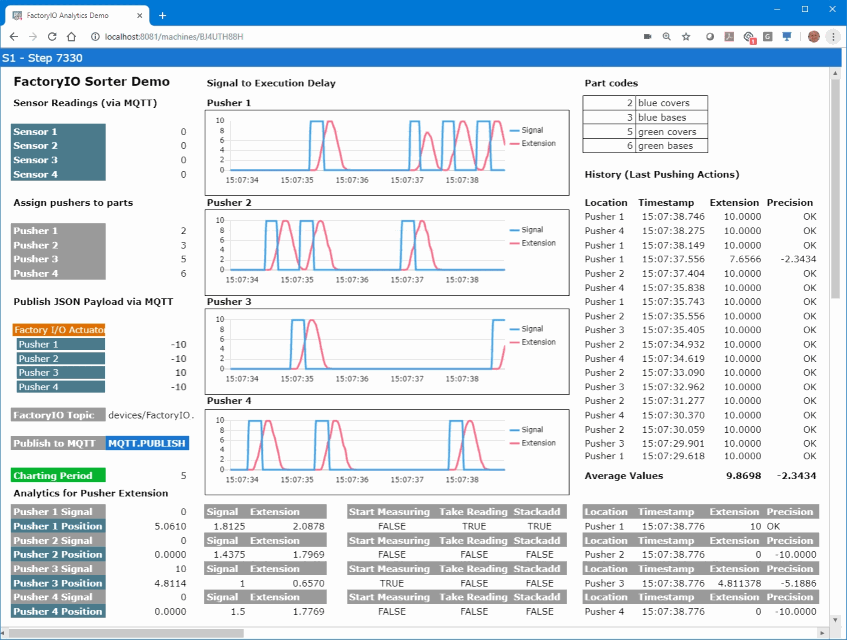
The dashboard continuously reads the current position of the pushers to find out if all 4 pushers are extending the full way or if they stop earlier. If they average value of the pusher extensions gets below the standard value of (in this case) 10, some maintenance is needed for this machinery.
The dashboard uses time charts to show the pusher signal and the actual position of the pusher in real-time. It also shows the history of the readings in a table view.
In the following 5 minute video I will show how to build the dashboard. I suggest that you view this video in full screen mode.
https://www.youtube.com/watch?v=xQPmsTYvpes&feature=youtu.be&ab\_channel=Cedalo
Analyzing the accuracy of an industrial process with Streamsheets


