
The increase of Internet of Things (IoT) devices brings many challenges, ranging from potential points of failure to security vulnerabilities posed by malicious attackers. As IoT ecosystems grow in complexity, ensuring the reliability and security of these networks becomes increasingly important.
One crucial feature helping IoT developers and administrators mitigate such issues is the possibility of logging a running system. Broker logs provide useful operations insights by recording the most important events and providing basic information about them. Moreover, advanced features like Audit Trail, elevate logging to another level, capturing comprehensive and secure records of every action taken within the MQTT broker and the Management Center (MMC).
This article will provide a deep insight into the classical Mosquitto Logging and the Pro Edition for Eclipse Mosquitto™ Audit Trail feature.
Introduction to logging in Mosquitto
While the open-source Mosquitto broker already provides basic logging capabilities, the professional version of Mosquitto introduces the Audit Trail feature.
Understanding the distinctions between these two types of logging is crucial for comprehensive system monitoring and security.
- Mosquitto’s classical logging records basic information on operations, such as message publications, subscriptions, client connections, and disconnections. This is useful for general system oversight and troubleshooting.
- Audit Trail, however, provides thorough information on broker operations and links each operation to the respective user/client in the system. This makes it suitable for advanced system monitoring, compliance, and forensic analysis. Audit trail log entries are made to be sent to other systems for subsequent processing and analysis. They follow a JSON format for ease of parsing, unlike basic logs, which are plain text messages. To learn how JSON Web Tokens (JWT) can help authenticate and enhance log security for the Mosquitto MQTT broker, refer to this article.
Request a Cedalo MQTT Platform trial to leverage the Pro Edition for Eclipse Mosquitto’s logging features. The trial also includes Persistent Queueing, MQTT High Availability configuration, and more.
The following chapters will demonstrate the two types of logging, starting with the classical Mosquitto logging.
Classical Mosquitto logging
Mosquitto offers two logging mechanisms, which I will refer to as:
- System status logging
- General multi-transport logging
Mosquitto system status logging
System status logging, often called $SYS topic logging, consists of a specific type of logs published over a designated topic. Accessing this logging requires subscribing to the relevant topic of interest. These logs offer meaningful information about the broker’s status and statistics, including metrics such as the number of published messages and connected clients. You can refer to this GitHub page for a comprehensive list of logging topics.
The sys topic logging is active by default, and the only possible configuration parameter is the sys_interval option in the mosquitto.conf file. This parameter allows you to define the interval between messages in seconds. Setting this value to zero turns off the logging.
To test this logging, you can use the following command, which will subscribe to the topic reporting a number of currently connected clients:
mosquitto_sub -h localhost -t '$SYS/broker/clients/connectedNote: you can install mosquitto_sub utility with ‘mosquitto’ or ‘mosquitto-clients’ package on Unix systems. If you are using Windows, you can refer to this guide or use other tools such as MQTT Explorer.
Mosquitto general multi-transport logging
In addition to the sys topic logging, Mosquitto records important broker activities, such as client connections or disconnections, subscriptions, etc., and sends them to configured destinations (transports). A typical default destination for such logs is the console (stdout or stderr).
You can configure these logs through the Mosquitto configuration file.
Open the mosquitto.conf file and search the “Logging” section.
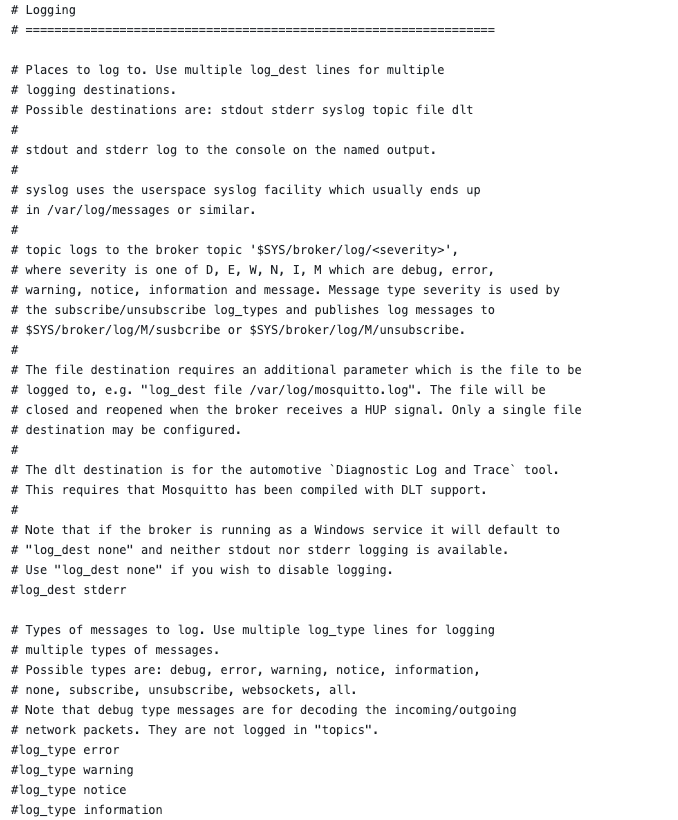
Figure 1 - Logging section of mosquitto.conf file.
The configuration consists of different parameters, but I will only focus on the two most important ones: log_dest and log_type.
The log_dest parameter allows the selection of the destination, where logs should be sent. Permissible values are:
- stdout or stderr → Log to the console.
- syslog → Redirect logs to syslog utility.
- topic → Log to $SYS/broker/log/
topic - file → Log to a file
- none → Disable logging feature.
In this demonstration, I will specify stdout (Figure 2).
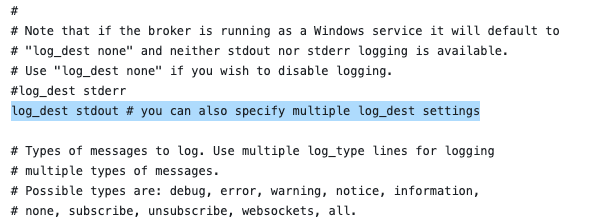
Figure 2 - Selecting stdout as the log output destination.
The other parameter is log_type, which allows you to select the type of messages to log. The official Mosquitto man page contains a comprehensive list of valid values.
In my example, I will set the log_type value to all, instructing the broker to log all possible events (Figure 3).
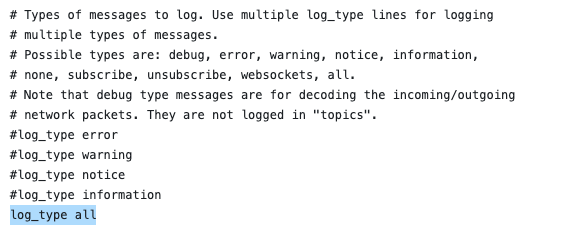
Figure 3 - Setting log_type to all will generate all possible logs.
Now, save the mosquitto.conf file and start Mosquitto using the following command:
mosquitto -c /your/path/to/mosquitto.confThe logging will start, as shown below:
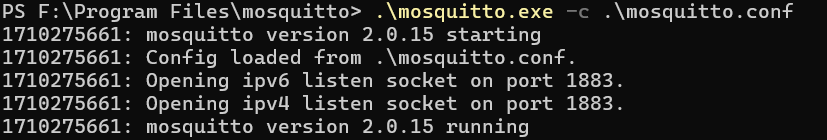
Figure 4 - Mosquitto starts, showing the logs on stdout.
If you try to subscribe to a topic using the following command, Mosquitto detects and logs this event:
mosquitto_sub -h localhost -t '/test/topic'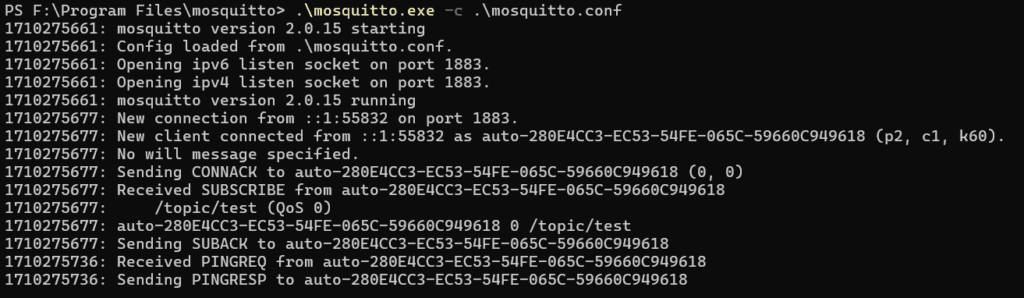
Figure 5 - Mosquitto logs the client connection and the subscription request over /topic/test.
Secure logging for reliable MQTT systems: Audit Trail
An audit trail is a chronological record of detailed event logs, including their origins and endpoints. It offers proof of the sequence of actions affecting a specific operation within a system and is essential for security and reliability of systems with strict requirements.
Pro Mosquitto integrates Audit Trail, facilitating detailed tracking of the MMC and broker operations. Typically, Audit Trail logs redirect to syslog - a standard solution for log collection and handling.
Logging Mosquitto to syslog
Syslog is a standard protocol for logging in computer systems. It specifies a message format that applications can use to generate and send event messages to a central repository, typically a syslog server or daemon. This server forwards this data to other systems or stores it. The messages contain information about system errors, warnings, informational notes, and other relevant activities.
In this article, I will use rsyslog, a daemon service for the centralized handling of logs which is compliant with the syslog protocol. Such daemons can sometimes be referred to as syslogs.
Mosquitto Audit Trail setup: Three container solution
Let’s explore a setup that forwards audit trail logs from Mosquitto and MMC to rsyslog service running in a separate container. This approach is a containerized, cross-platform, deployment-ready example of handling audit trail logs. The logs from both systems will be gathered in one place where they are available for further processing or forwarding.
Alternatively, you may install rsyslog on your host system and mount /dev/log into both broker and MMC containers.
This example will use a Docker-based configuration through Docker Compose. This guide assumes you have already installed Docker on your system. For preliminary information about Mosquitto and Docker, check out the official Mosquitto Docker guide. However, this article provides a different and more complex solution.
For this project, I will use the latest Pro Edition for Eclipse Mosquito on-premises license by requesting a Cedalo MQTT Platform trial. The trial includes basic MQTT HA configuration and access to advanced features like Audit-Trail logging.
The example consists of three components:
- The Pro Mosquitto broker
- Management Center for Mosquitto™
- A syslog server
The broker and MMC containers will send their logs to the syslog container through a Unix socket. This will require a particular bind mounting to share the Unix socket created by the rsyslog process. Figure 6 provides a representation of the setup.
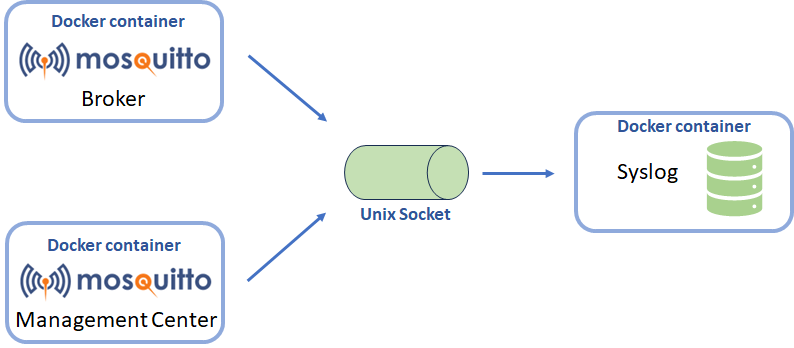
Figure 6 - Communication between Mosquitto, MMC, and syslog server containers.
The setup is not complicated but requires careful implementation. The entire configuration is performed through the docker_composer.yml file, which is provided with Pro Mosquitto.
By default, the provided YAML file configures Pro Mosquitto and the MMC for classical usage. However, I will introduce some changes to implement the structure shown in Figure 6.
In the following chapters, I will post only the relevant YAML file parts to maintain focus on the appropriate sections of the Docker compose configuration for rsyslog container.
First, I’ll introduce the new syslog docker container shown below. You have to insert this new section in the services entry of the docker-compose.yml file:
rsyslog:
    	image: ubuntu:latest
    	container_name: rsyslog
    	volumes:
      	- /tmp/dev:/tmp/dev
            - /var/log:/var/log
    	command:
        	- /bin/sh
        	- -c
        	- |
            	rm -f /tmp/dev/log &&
            	apt-get update -q && apt-get install -y rsyslog &&
            	sed -i '/module(load="imuxsock")\s*\(.*\)$$/a input(type="imuxsock" Socket="/tmp/dev/log" CreatePath="on")' /etc/rsyslog.conf &&
            	rsyslogd -n
This configuration adds a new Docker service named rsyslog, using the latest Ubuntu version as an image. The setup will also create a volume binding between /tmp/dev directory on your host machine and /tmp/dev inside the docker container (you may specify a different path for your host).
This volume is essential to getting the three systems working. It is where the syslog will create the unix socket accessible by the other two Docker containers, instead of using the default /dev/log path. Another volume binds /var/log where rsyslog typically stores the received logs. This allows convenient access to the stored logs from the host machine.
Finally, once the Ubuntu image starts, the command sequence in the command section is executed.
Excluding the first command that initiates the bash inside the docker, you have the following command:
rm -f /tmp/dev/logThis command ensures that the path where rsyslog will create a listening unix socket doesn’t contain an object with the same name. The following commands will install rsyslog.
apt-get update -q && apt-get install -y rsyslogWith rsyslog installed, the following configurative command is issued:
sed -i '/module(load="imuxsock")\s*\(.*\)$$/a input(type="imuxsock" Socket="/tmp/dev/log" CreatePath="on")' /etc/rsyslog.confThis command edits the rsyslog configuration file, instructing it to create an input socket at a custom path: /tmp/dev/log. This socket will listen to logs from other containers.
The last command starts the rsyslog process:
rsyslogd -nDocker compose configuration for MMC and Mosquitto
Now, I’ll describe the configuration of the Mosquitto and MMC containers. Given that the YAML configuration changes are nearly identical for both containers, I’ll cover them together.
To begin, divide the configuration changes into two steps: binding the volume with the input socket and waiting until rsyslog creates this socket.
First, I will configure the bind volume for the unix socket by adding the following line in the container’s volume section:
/tmp/dev:/tmp/devThis will mount the same /tmp/dev bind volume from rsyslog into the Mosquitto and Mosquitto web interface containers, allowing the Unix socket to be shared between all three containers.
Secondly, I’ll introduce the following just after the volume section:
entrypoint: >
        	/bin/sh -c "
            while ! test -S /tmp/dev/log;
            	do
                	    echo 'Waiting for rsyslog container';
                	    sleep 1;
            	done;
            	rm -f /dev/log;
            	ln -s /tmp/dev/log /dev/log;
            	/docker-entrypoint.sh /usr/sbin/mosquitto -c /mosquitto/config/mosquitto.conf
        	"
depends_on:
        	- rsyslog
Here, the entrypoint section allows you to change the container’s main command. The specified instructions will run instead of the usual command specified in the Dockerfile of the image.
The new entrypoint implements a waiting loop pending the creation of the syslog socket. The purpose of waiting for the socket creation is because you need a symlink linking it to the standard rsyslog unix socket location (/dev/log), where Mosquitto sends audit trail logs.
Once Mosquitto creates the syslog socket, it removes any pre-existing /dev/log socket and creates a symlink between /tmp/dev/log and /dev/log.
Finally, the Pro Mosquitto or MMC starts. Note that the MMC startup command, /management-center/mmc, differs from the one for the Mosquitto container.
Putting everything together, you will get the following docker-compose file:
version: '3.7'

services:
    rsyslog:
        image: ubuntu:latest
        container_name: rsyslog
        volumes:
          - /tmp/dev:/tmp/dev
          - /var/log:/var/log
        command:
            - /bin/sh
            - -c
            - |
                rm -f /tmp/dev/log &&
                apt-get update -q && apt-get install -y rsyslog &&
                sed -i '/imklog/s/^/#/' /etc/rsyslog.conf &&
                sed -i '/module(load="imuxsock")\s*\(.*\)$$/a input(type="imuxsock" Socket="/tmp/dev/log" CreatePath="on")' /etc/rsyslog.conf &&
                rsyslogd -n

    mosquitto:
        image: registry.cedalo.com/mosquitto/mosquitto:2.7
        container_name: mosquitto
        ports:
            - 127.0.0.1:1888:1883
            - 8888:8883
            - 8090:8090
        volumes:
            - ./mosquitto/config:/mosquitto/config
            - ./mosquitto/data:/mosquitto/data
            - ./management-center/config:/mosquitto/license
            - /tmp/dev:/tmp/dev
        environment:
            CEDALO_LICENSE_FILE: /mosquitto/license/license.lic
        restart: unless-stopped
        entrypoint: >
            /bin/sh -c "
                while ! test -S /tmp/dev/log;
                do
                    echo 'Waiting for rsyslog container';
                    sleep 1;
                done;
                rm -f /dev/log;
                ln -s /tmp/dev/log /dev/log;
                /docker-entrypoint.sh /usr/sbin/mosquitto -c /mosquitto/config/mosquitto.conf
            "

        depends_on:
            - rsyslog

    management-center:
        image: registry.cedalo.com/mosquitto/management-center:2.7
        container_name: management-center
        environment:
            CEDALO_HOST_NAME: ${CEDALO_HOST_NAME}
            CEDALO_IP_ADDRESS: ${CEDALO_IP_ADDRESS}
            CEDALO_MC_PROXY_HOST: 0.0.0.0

            CEDALO_MC_USERNAME: cedalo
            CEDALO_MC_PASSWORD: mmcisawesome

            CEDALO_MC_PROXY_SRT_BASE: /management-center/config
            CEDALO_MC_LICENSE_PATH: /management-center/config/license.lic

            CEDALO_MC_PROXY_CONFIG: /management-center/config/config.json
            CEDALO_MC_PROXY_CONFIG_CERTS: /management-center/config/certs.db
            CEDALO_MC_PROXY_CONFIG_TOKENS: /management-center/config/tokens.json
            CEDALO_MC_PROXY_CONFIG_USERS: /management-center/config/users.json
            CEDALO_MC_PROXY_CONFIG_AUDIT_TRAIL: /management-center/config/audit.json

            CEDALO_MC_DATA_DIRECTORY_PATH: /management-center/config

            CEDALO_MC_MODE: offline
        ports:
            - 127.0.0.1:8089:8088
        volumes:
            - ./management-center/config:/management-center/config
            - ./management-center/data:/data/
            - /var/run/docker.sock:/var/run/docker.sock
            - /tmp/dev:/tmp/dev
        command: >
            /bin/sh -c "
                while ! nc -z mosquitto 1883;
                do
                    echo 'Waiting for mosquitto';
                    sleep 1;
                done;
                while ! test -S /tmp/dev/log;
                do
                    echo 'Waiting for rsyslog container';
                    sleep 1;
                done;
                rm -f /dev/log;
                ln -s /tmp/dev/log /dev/log;
                /management-center/mmc
            "
        restart: unless-stopped
Configuring Audit Trail logging for Pro Mosquitto and MMC
Before running the docker-compose setup, let’s discuss how to enable and configure Audit Trail. It’s important to note that configuring the Audit Trail feature differs between the Pro Mosquitto broker and the MMC. Each relies on different plugins and configuration files. Therefore, I will explain the configuration process in two separate chapters. The following figure provides an overview of the configuration structure across the two applications.
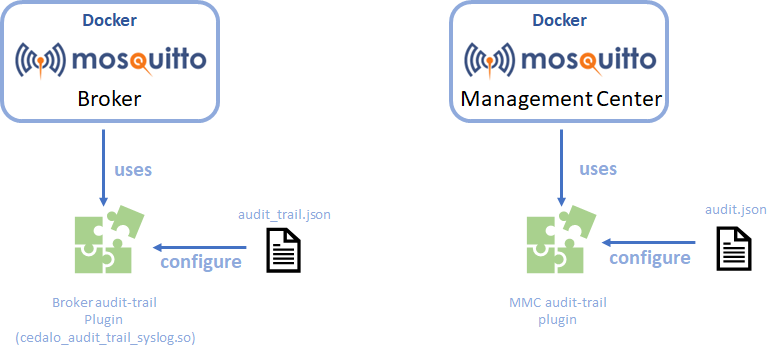
Figure 7 - Pro Mosquitto and Management Center Audit Trail plugin design.
Configure the Audit Trail feature for Pro Mosquitto MQTT broker
Configuring the Audit Trail for the broker is straightforward and consists of two steps. First, instruct Pro Mosquitto to load the Audit-Trail plugin by adding the following line into the mosquitto.conf:
global_plugin /usr/lib/cedalo_audit_trail_syslog.soOnce done, proceed with the plugin configuration. The configuration file is named audit_trail.json, located in mosquitto/data mapped into the container. Open the file and paste the following content to prepare a functioning configuration.
{
 "filters":
}
The Pro Mosquitto Audit-Trail configuration is organized in filters. The filters define the events and actions to be included or excluded from the logs.
In this example, I reduce the configuration to only log client connect and broker start events. This is sufficient for a quick test, but the official documentation offers further information on loggable events and other possible configurations.
Configure the Audit Trail feature for MMC
As mentioned, the MMC also supports Audit Trail, allowing for comprehensive logging of actions like user creation, cluster management, etc.
To enable the feature, go to either the plugins.json or config.json file (depending on availability) under the ‘management-center/config’ directory, locate the plugin section, and add the following:
{
    "id": "audit-trail"
},
Now, you can edit the audit trail configuration file audit.json under ‘management-center/config’ (or create it if it doesn’t exist).
Below is an example of the file; however, the official documentation provides a complete and recommended example.
[
	{
    	"logger": "syslog",
    	"options": {
        	"protocol": "unix",
        	"path": "/dev/log"
    	},
    	"disable": false,
    	"logThreshold": "debug",
    	"defaultLoglevel": "info",
    	"filters": ,
    	"operations":
	}
]
This configuration comprises several sections. While you can refer to the documentation for more details, I will still introduce the most relevant parts.
The first section is the logger entry, which defines the destination of the audit trail logs generated by the MMC. You can redirect these logs to several output destinations, like “file” or “console”, but I will use “syslog” here.
The options field specifies additional settings of syslog communication, which, in this case, is set to the classical /dev/log Unix socket.
Then, the logThreshold sets a threshold for which logs with lower severity levels will not be logged. The filters section allows you to configure which actions and events the MMC logs. This section has an identical structure to the broker’s filters section. In this example, I will set the filter to log only the client creation, user login, and application startup.
Finally, the operations field allows you to set a specific log level for a particular operation. All the other operations not specified in this section will be logged with defaultLoglevel.
Upon successfully enabling the plugin and configuring audit.json, the following line will print into the console on MMC startup:
Loaded plugin: "audit-trail" (Cedalo Audit Trail)Exploring Pro Mosquitto logs
After completing all the configurations, you can run the modified docker-compose setup with the following command:
docker-compose up -dTo confirm if the setup is correct, inspect the docker container to see if /tmp/dev/log socket was created in a:
docker exec -it rsyslog ls -al /tmp/devThe expected output should be as in the following figure.
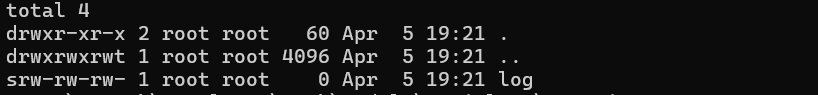
Figure 8 - ‘ls’ command shows that the log socket is present.
This demonstrates that the “log” socket is present. Note the s flag in the file permissions, indicating it’s a socket.
You can also execute the following command to display the last 300 lines of the syslog:
docker exec -it rsyslog tail -300 /var/log/syslogAfter executing the command, some events that were already forwarded and stored on the syslog server up to this point, such as broker and MMC startup, should be displayed.
The audit trail logs store information in JSON format. Below is an example of the indented MMC log fired when a user creates an MQTT client through the web UI.
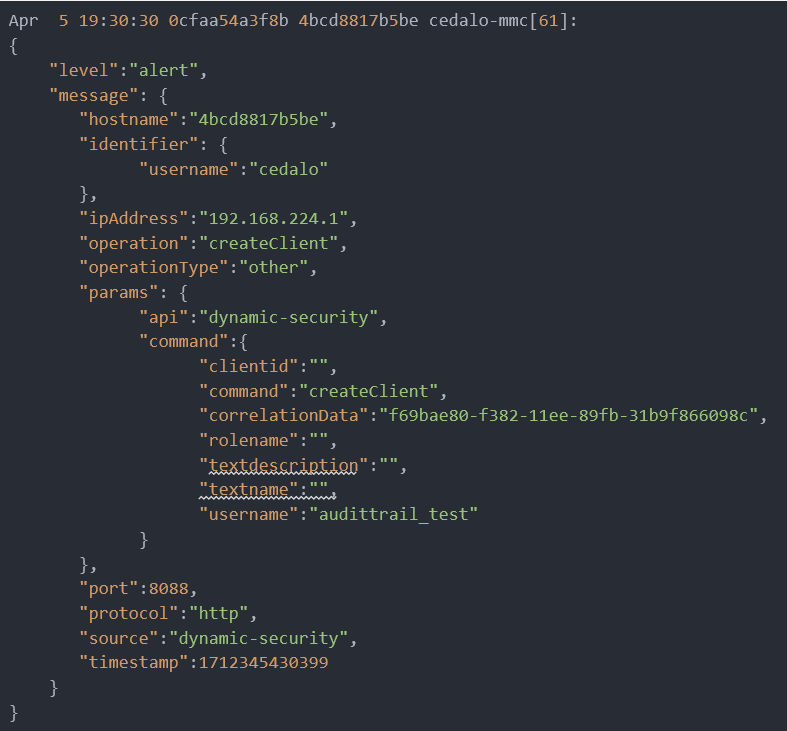
Figure 9 - MMC’s audit trail log record.
Here is an example of how a broker logs a client connection:
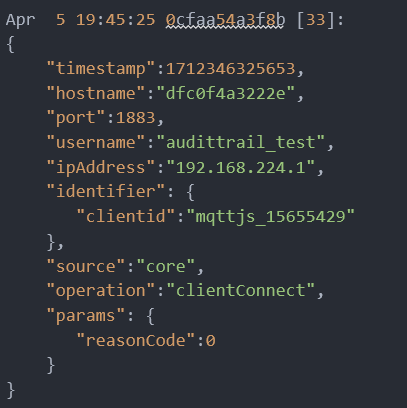
Figure 10 - Mosquitto’s audit trail log record.
Conclusion
This article explores the different logging features of the Pro Mosquitto broker and demonstrates practical examples of its capabilities for managing and overseeing message communication within an MQTT network. These features are not mutually exclusive and work best together. You can utilize the classical logs for general insight into the system and troubleshooting. On the other hand, audit trail logs provide more detailed information useful for system monitoring and security purposes.
You can request a free Pro Edition for Eclipse Mosquitto license through the Cedalo MQTT Platform trial to explore these logging capabilities. The trial includes access to advanced features like Audit trail and basic MQTT HA configuration, allowing you to record broker activities for better security and reliability.


