Shopify Dashboard (Part 2): How to aggregate and chart Kafka data in Streamsheets
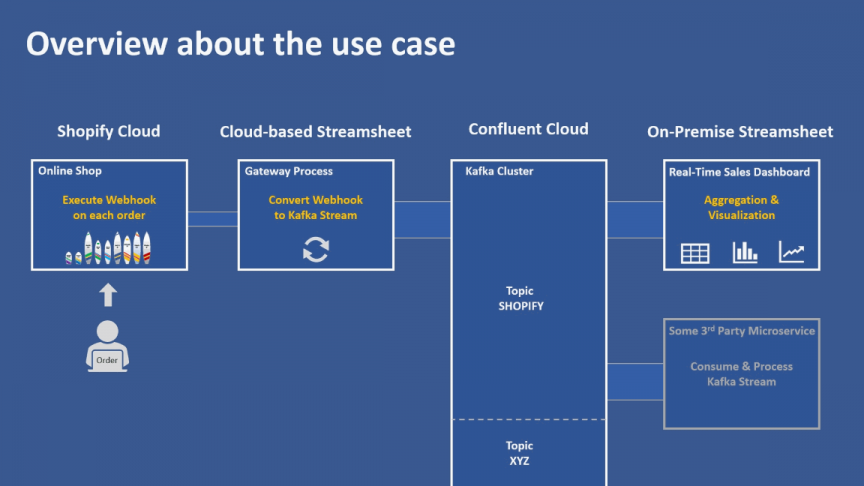
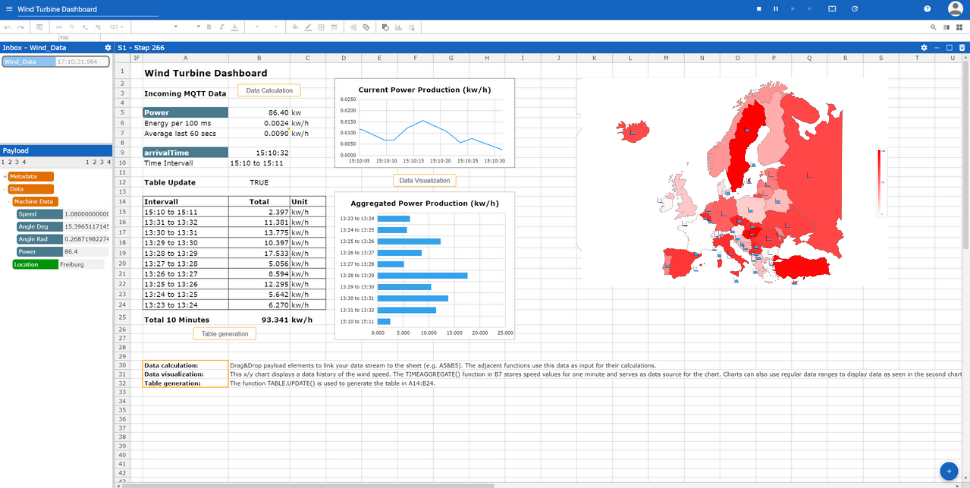
This is the second part of the Shopify/Kafka/Streamsheet use case. In the first part, we built a cloud based gateway to connect a Shopify store to Apache Kafka (hosted on the Confluent Cloud). In this second part, we build a Streamsheet on a second Streamsheet Server that subscribes to the Kafka cluster and displays the real time data from Shopify in a dashboard.
This second Streamsheet Server runs on-premise behind the local firewall. Since the Kafka connection is initiated from the local Streamsheet Server, it can easily receive the event driven data from the Kafka cluster in the cloud. This is one of the beauties of the broker concept behind Kafka.
The following slide shows the setup of this use case.

In the video, you will see how to aggregate and chart the data from the Kafka cluster that we used in the previous post. In the video, I demonstrate 2 different ways on how to store the aggregated data. First I simply use Streamsheet cells to store the aggregated data. This will work if you only need the data persisted for a limited time (for example the last 300 sales). At the end of the video, I show an alternative way using MongoDB. This allows to store the aggregated data persistently over long periods of time. And it also allows to retrieve the data from other applications. This could be another Streamsheet or even a 3rd party application build with another programming framework.
I recommended watching the following video in full screen mode. The video is about 12 minutes long.
About the author
Kristian Raue is a co-founder of Cedalo GmbH. Previously, he was the founder and CEO of Jedox AG in Freiburg, a leading provider of Business Intelligence software with locations in the USA, Australia, and Singapore.
From 1991 to 2000, Kristian Raue was the CEO of IntelliCube Software AG, which has merged with the INFOR Group. Kristian Raue studied industrial engineering with a focus on mechanical engineering at TU Darmstadt.


